Sorry can't give you a reference. I wrote code a few years ago to look at this effect. I found that code and here is one figure I plotted. This is based on real stock price data for QCOM stock price 1999 through 2005. In this figure, I am looking at stock prices about 36 days apart.
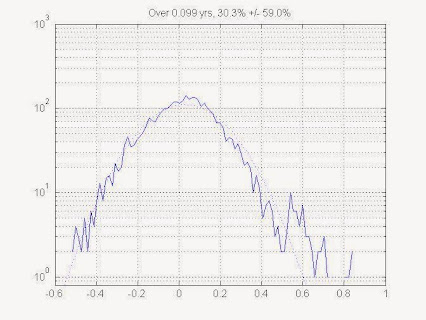 Stock price volatility from data. The random variable is log(P2/P1), the log of the later price to the earlier price. In this plot, P2 occurs 0.1 years after P1. A histogram is plotted with a logarithmic axis for the histogram count. A gaussian (bell curve) is fitted to the histogram, with a logarithmic y-axis, a gaussian is just a parabola. You can see the fit is great, except for some outliers on the positive side. Some of these outliers are quite a lot higher than the fitted gaussian, these are events that occur MANY TIMES more often that a log-normal distribution would suggest.
Thanks, that's very useful!
Most models attempting to estimate or predict some elements of the world, will come with their own estimates of uncertainty. It could be the Standard Model of physics predicting the mass of the Z boson as 91.1874 ± 0.0021 GeV, or the rather wider uncertainty ranges of economic predictions.
In many cases, though, the uncertainties in or about the model dwarf the estimated uncertainty in the model itself - especially for low probability events. This is a problem, because people working with models often try to use the in-model uncertainty and adjust it to get an estimate of the true uncertainty. They often realise the model is unreliable, but don't have a better one, and they have a measure of uncertainty already, so surely doubling and tripling this should do the trick? Surely...
The following three cases are going to be my go-to examples for showing what a mistake this can be; they cover three situations: extreme error, being in the domain of a hard science, and extreme negative impact.
Black Monday
On October 19, 1987, the world's stock markets crashed, shedding a huge value in a very short time. The Dow Jones Industrial Average dropped by 22.61% that day, losing between a fifth and a quarter of its value.
How likely was such an event, according to the prevailing models of the time? This was apparently a 20-sigma event, which means that the event was twenty standard deviations away from the expected behaviour.
Such events have a probability of around 10-50 of happening, which in technical mathematical terms is classified as "very small indeed". If every day were compressed into a second, and the stock markets had been running since the big bang... this gives us only about 1017 seconds. If every star in the observable universe ran its own stock market, and every day were compressed into a second, and we waited a billion times the lifetime of the universe... then we might expect to observe a twenty sigma event. Once.
No amount of reasonable "adjusting" of the probability could bring 10-50 into something plausible. What is interesting, though, is that if we took the standard deviation as the measure of uncertainty, the adjustment is much smaller. One day in a hundred years is a roughly 3x10⁻⁵ event, which corresponds very roughly to three standard deviations. So "simply" multiplying the standard deviation by seven would have been enough. It seems that adjusting ranges is more effective than adjusting probabilities.
Castle Bravo
But economics is a soft science. Surely errors couldn't occur in harder sciences, like physics? In nuclear bomb physics, where the US had access to the best brains and the best simulations, and some of the best physical evidence (and certainly a very high motivation to get it right), such errors could not occur? Ok, maybe at the very beginning, but by 1954, the predictions must be very accurate?
The Caste Bravo hydrogen bomb was the highest yield nuclear bomb ever detonated by the United States (though not necessarily intended to be). The yield was predicted to be 6 megatons of TNT, within a maximum range of 4 to 8. It ended up being an explosion of 15 megatons of TNT, around triple the expectation, with fallout landing on inhabited islands(on the Rongelap and Utirik atolls) and spreading across the world, killing at least one person (a Japanese fisherman).
What went wrong? The bomb designers considered that the lithium-7 isotope used in the bomb was essentially inert, when in fact it... wasn't. And that was sufficient to triple the yield of the weapon, far beyond what the designers had considered possible.
Again, extending the range is more successful than adjusting the probabilities of high events. And even the hard sciences are susceptible to great errors.
Physician, wash thyself
The previous are good examples of dramatic underestimates of uncertainty by the model's internal measure of uncertainty. They are especially good because we have numerical estimates of the internal uncertainty. But they lack one useful rhetorical component: evidence of a large scale disaster. Now, there are a lots of of models to choose from which dramatically underestimated the likelihood of disaster, but I'll go with one problem in particular: the practice that doctors used to have of not washing their hands.
Ignaz Semmelweis noted in 1847 that women giving birth in the presence of doctors died at about twice the rate of those attended only by midwives. He correctly deduced that doctors were importing something from their experiments on cadavers, and that this was causing the women to die. He instituted a policy of using a solution of chlorinated lime for washing hands between autopsy work and the examination of patients - with great success, sometimes even reducing the death rate to zero in some months.
This caused a problem. Semmelweis was unable to convince other doctors about this, for a variety of standard biases. But the greatest flaw was that he had no explanation for this behaviour. Yes, he could point at graphs and show improvements - but there was nothing in standard medical theory that could account for it. The other doctors could play around with their models or theories for days, but they could never explain this type of behaviour.
His claims, in effect, lacked scientific basis. So they ignored them. Until Pasteur came up with a new model, there was just no way to understand these odd results.
The moral of this is that sometimes the uncertainty can not only be much greater than that of the model. Sometimes the uncertainty isn't even visible anywhere in the model.
And sometimes making these kinds of mistakes can lead to millions of unnecessary deaths, and the decisions made (using doctors for childbirths) have the absolute opposite effect than was intended.