Edit: the list is now a public GitHub repository, with all that implies. Added sections by media type. Last update: 6 Jan 2021
Motivation
This is The Best Textbooks on Every Subject, but for visualizations. I greatly adore good visualizations, chiefly because there are so many visualizations that are so terrible. I have seen many such tools mentioned here, but always in passing.
The actual motivator is re-reading the posts Exercises in Comprehensive Information Gathering and Fact Posts: How and Why. While there is no substitute for the wrench-time they recommend, I think these kinds of tools make the process more efficient and lend themselves to insights which are difficult to acquire through reading alone; in my experience scale and distance are both easier to grasp in a visual medium, for example.
Also there is a non-trivial sense in which they are beautiful in their own right. If we are able to compare many examples, people in the community might even be able to help advance the art.
Submission Rules
One nomination per comment; please include an explanation of why you nominated it. Contra the best textbooks list we won't require comparison with other visualizations because there are so few authoritative ones.
Current List
WEB:
History
- ORBIS: The Geospatial Network Model of the Roman World: https://orbis.stanford.edu/
- Data Visualization and the Modern Imagination: https://exhibits.stanford.edu/dataviz
- A Simulated Dendrochronology of Immigration 1790-2016: https://web.northeastern.edu/naturalizing-immigration-dataviz/
Math
- Byrne's Euclid: The First Six Books of the Elements of Euclid With Coloured Diagrams and Symbols: https://www.c82.net/euclid/
- The Empirical MetaMathematics of Euclid and Beyond: https://writings.stephenwolfram.com/2020/09/the-empirical-metamathematics-of-euclid-and-beyond/
- An Interactive Introduction to Fourier Transforms: http://www.jezzamon.com/fourier/
- Better Explained: https://betterexplained.com/
- Jason Davies: Math and Cartography: https://www.jasondavies.com/
- Bit-player: "An amateur’s outlook on computation and mathematics": http://bit-player.org/
Economics
- The Observatory of Economic Complexity: https://oec.world/
- Our World in Data: https://ourworldindata.org/
Machine Learning
- Distill: https://distill.pub/
Miscellaneous
- Explorable Explanations: https://explorabl.es/
- Complexity Explorables: https://complexity-explorables.org/
- The Pudding Visual Essays: https://pudding.cool/
VIDEO:
BOOKS:
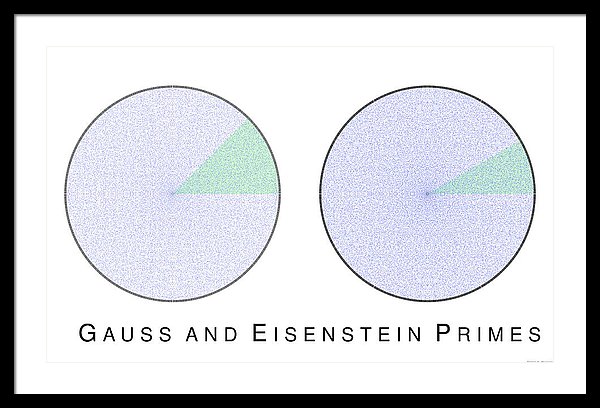
- An Illustrated Theory of Numbers: http://illustratedtheoryofnumbers.com/
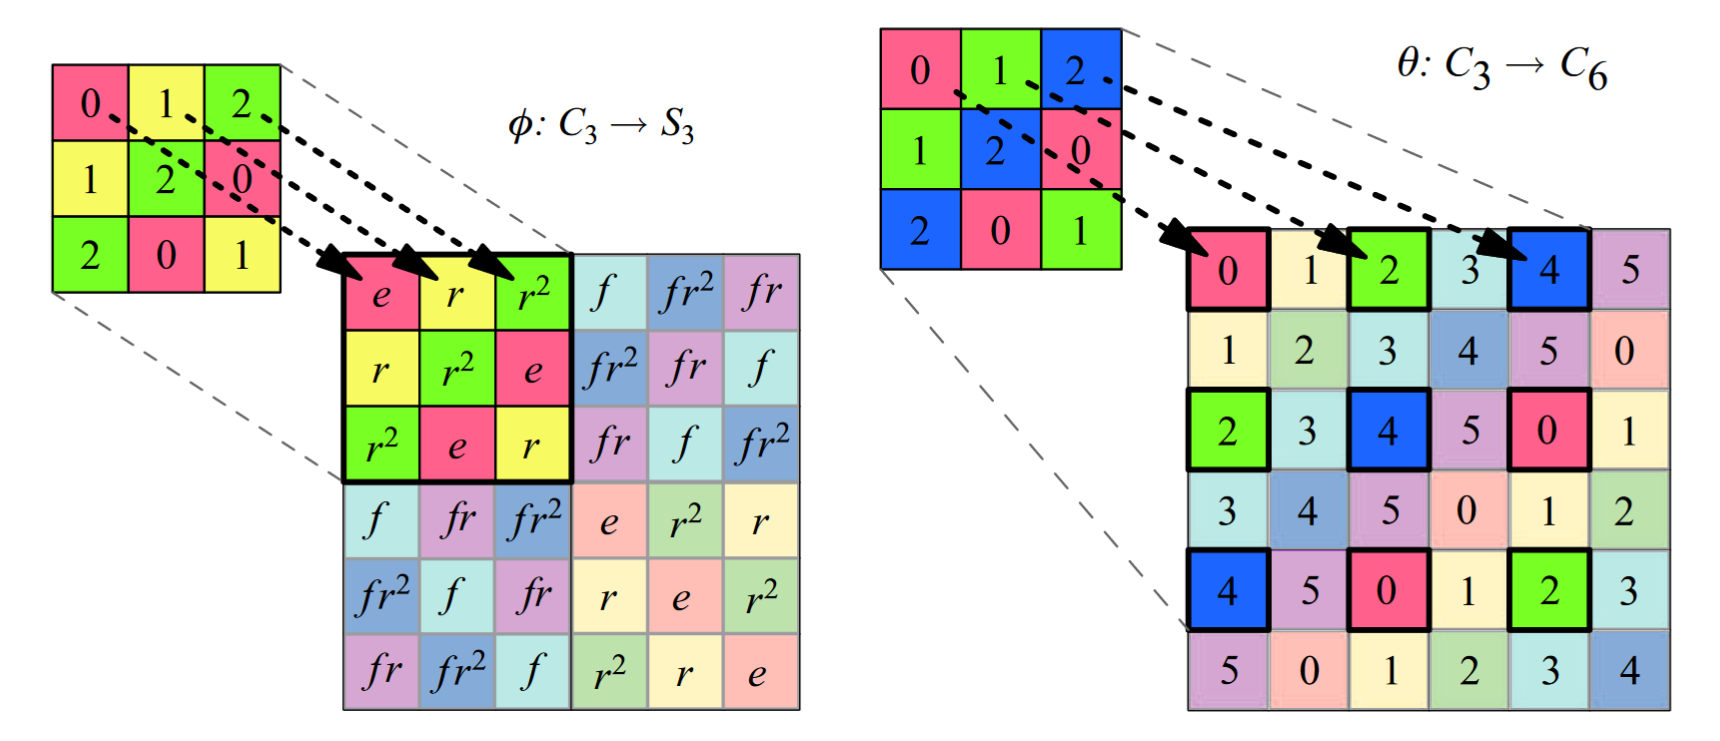
- Visual Group Theory: https://bookstore.ams.org/clrm-32/
- Dataclysm: https://www.amazon.com/Dataclysm-Identity-What-Online-Offline-Selves/dp/0385347391
JOURNALISM:
- Europe's HIV Divide: https://www.politico.eu/article/aids-european-state-of-play/
- Explore 175 Years of Word Usage in Scientific American: https://www.scientificamerican.com/article/explore-175-years-of-words-in-scientific-american/

Definetely not a subject, but I'd say that the visualisation of Wolfram's theory of everything is excellent. Of course there are problems with his theory of everything, like the fact that he hasn't actually proved his claims that it generates GR field equations or replicates QM. Or shown that his theory evades the critical objection Scott Aaronson raised. but as a visualisation:
So I'd still recommend it.