It's not clear to me that the virtue theory of metabolism is a good example for this post, since it's likely to be highly contentious.
It seems clear to me that it is a very bad example. I find that consistently the worst part of Eliezer's non-fiction writing is that he fails to separate contentious claims from writings on unrelated subjects. Moreover, he usually discards the traditional view as ridiculous rather than admitting that its incorrectness is extremely non-obvious. He goes so far in this piece as to give the standard view a straw-man name and to state only the most laughable of its proponents' justifications. This mars an otherwise excellent piece and I am unwilling to recommend this article to those who are not already reading LW.
Yeah, I didn't even mind the topic, but I thought this particular sentence was pretty sketchy:
in the virtue theory of metabolism, lack of exercise actually causes weight gain due to divine punishment for the sin of sloth.
This sounds like a Fully General Mockery of any claim that humans can ever affect outcomes. For example:
in the virtue theory of traffic, drinking alcohol actually causes accidents due to divine punishment for the sin of intemperance
in the virtue theory of conception, unprotected sex actually causes pregnancy due to divine punishment for the sin of lust
And selectively applied Fully General Mockeries seem pretty Dark Artsy.
in the virtue theory of traffic, drinking alcohol actually causes accidents due to divine punishment for the sin of intemperance
Of course not! The real reason drinkers cause more accidents is that low-conscientiousness people are both more likely to drink before driving and more likely to drive recklessly. (The impairment of reflexes due to alcohol does itself have an effect, but it's not much larger than that due to e.g. sleep deprivation.) If a high-conscientiousness person was randomly assigned to the “drunk driving” condition, they would drive extra cautiously to compensate for their impairment. ;-)
(I'm exaggerating for comical effect, but I do believe a weaker version of this.)
I agree that focusing on input has far higher returns than focusing on output. Simple calorie comparison predicts it, and in my personal experience I've noted small appearance and weight changes after changes in exercise level and large appearance and weight changes after changes in intake level. That said, the traditional view- "eat less and exercise more"- has the direction of causation mostly right for both interventions and to represent it as just "exercise more" seems mistaken.
I was also distracted by the footnotes, since even though I found them quite funny, [3] at least is obviously wrong: "there's no known intervention which can cause weight loss." Sure there is -- the effectiveness of bariatric surgery is quite well evidenced at this point (http://en.wikipedia.org/wiki/Bariatric_surgery#Weight_loss).
I generally share Eliezer's assessment of the state of conventional wisdom in dietary science (abysmal), but careless formulations like this one are -- well, distracting.
It induces genuine curiosity about the truth
I suspect this depends on the handling of the issue. Eliezer presenting his model of the world as "common sense," straw manning the alternative, and then using fake data that backs up his preferences is, frankly, embarrassing.
This is especially troublesome because this is an introductory explanation to a technical topic- something Eliezer has done well before- and introductory explanations are great ways to introduce people to Less Wrong. But how can I send this to people I know who will notice the bias in the second paragraph and stop reading because that's negative evidence about the quality of the article? How can I send this to people I know who will ask why he's using two time-variant variables as single acyclic nodes, rather than a ladder (where exercise and weight at t-1 both cause exercise at t and weight at t)?
What would it look like to steel man the alternative? One of my physics professors called 'calories in-calories out=change in fat' the "physics diet," since it was rooted in conservation of energy; that seems like a far better name. Like many things in physics, it's a good first order approximation to...
Why do you need to send this article to people who could ask that?
Because I'm still a grad student, most of those people that I know are routinely engaged in teaching these sorts of concepts, and so will find articles like this useful for pedagogical reasons.
The point Eliezer is addressing is the one that RichardKennaway brought up separately. Causal models can still function with feedback (in Causality, Pearl works through an economic model where price and quantity both cause each other, and have their own independent causes), but it's a bit more bothersome.
A model where the three are one-time events- like, say, whether a person has a particular gene, whether or not they were breastfed, and their height as an adult- won't have the problem of being cyclic, but will have the pedagogical problem that the causation is obvious from the timing of the events.
One could have, say, the weather witch's prediction of whether or not there will be rain, whether or not you brought an umbrella with you, and whether or not it rained. Aside from learning, this will be an acyclic system that has a number of plausible underlying causal diagrams (with the presence of the witch making the example clearly fictional and muddying our causal intuitions, so we can only rely on the math).
In my opinion, the best fix would be to steelman the argument as much as possible.
The concept of inferential distance suggests to me that posts should try and make their pat...
Taking a "contentious" point and resolving it in to a settled fact
! From the article:
(which is totally made up, so don't go actually believing the conclusion I'm about to draw)
The net emotional result was the same for me as if he'd used the actual research, since my brain could substitute it in.
I understand. I think it's important to watch out for these sorts of illusions of transparency, though, especially when dealing with pedagogical material. One of the heuristics I've been using is "who would I not recommend this to?", because that will use social modules my brain is skilled at using to find holes and snags in the article. I don't know how useful that heuristic will be to others, and welcome the suggestion of others.
perhaps I am simply more familiar with the not-made-up research than you.
I am not an expert in nutritional science, but it appears to me that there is controversy among good nutritionists. This post also aided my understanding of the issue. I also detail some more of my understanding in this comment down another branch.
EDIT: Also, doing some more poking around now, this seems relevant.
Hi Eliezer,
Thanks for writing this! A few comments about this article (mostly minor, with one exception).
The famous statistician Fischer, who was also a smoker, testified before Congress that the correlation between smoking and lung cancer couldn't prove that the former caused the latter.
Fisher was specifically worried about hidden common causes. Fisher was also the one who brought the concept of a randomized experiment into statistics. Fisher was "curmudgeony," but it is not quite fair to use him as an exemplar of the "keep causality out of our statistics" camp.
Causal models (with specific probabilities attached) are sometimes known as "Bayesian networks" or "Bayes nets", since they were invented by Bayesians and make use of Bayes's Theorem.
Graphical causal models and Bayesian networks are not the same thing (this is a common misconception). A distribution that factorizes according to a DAG is a Bayesian network (this is just a property of a distribution -- nothing about causality). You can further say that a graphical model is causal if an additional set of properties holds. For example, you can (loosely) say that in a ca...
That's a clear outline of the theory. I just want to note that the theory itself makes some assumptions about possible patterns of causation, even before you begin to select which causal graphs are plausible candidates for testing. Pearl himself stresses that without putting causal information in, you can't get causal information out from purely observational data.
For example, if overweight causes lack of exercise and lack of exercise causes overweight, you don't have an acyclic graph. Acyclicity of causation is one of the background assumptions here. Acyclicity of causation is reasonable when talking about point events in a universe without time-like loops. However, "weight" and "exercise level" are temporally extended processes, which makes acyclicity a strong assumption.
However, "weight" and "exercise level" are temporally extended processes, which makes acyclicity a strong assumption.
This is a hugely important point in practical, everyday reasoning about causality. Feedback loops abound.
Pearl himself stresses that without putting causal information in, you can't get causal information out from purely observational data.
Koan: How, then, does the process of attributing causation get started?
The statisticians who discovered causality were trying to find a way to distinguish, within survey data, the direction of cause and effect - whether, as common sense would have it, more obese people exercise less because they find physical activity less rewarding; or whether, as in the virtue theory of metabolism, lack of exercise actually causes weight gain due to divine punishment for the sin of sloth.
I recommend that Eliezer edit this post to remove this kind of provocation. The nature of the actual rationality message in this post is such that people are likely to link to it in the future (indeed, I found it via an external link myself). It even seems like something that may be intended to be part of a sequence. As it stands I expect many future references to be derailed and also expect to see this crop up prominently in lists of reasons to not take Eliezer's blog posts seriously. And, frankly, this reason would be a heck of a lot better than most others that are usually provided by detractors.
I strongly agree.
I read that paragraph and noticed that I was confused. Because I was going through this post to acquire a more-than-cursory technical intuition, I was making a point to followup on and resolve any points of confusion.
There's enough technical detail to carefully parse, without adding extra pieces that don't make sense on first reading. I'd prefer to be able to spend my carful thinking on the math.
As was written in this seminal post:
In Artificial Intelligence, and particularly in the domain of nonmonotonic reasoning, there's a standard problem: "All Quakers are pacifists. All Republicans are not pacifists. Nixon is a Quaker and a Republican. Is Nixon a pacifist?"
What on Earth was the point of choosing this as an example? To rouse the political emotions of the readers and distract them from the main question? To make Republicans feel unwelcome in courses on Artificial Intelligence and discourage them from entering the field? (And no, before anyone asks, I am not a Republican. Or a Democrat.)
Why would anyone pick such a distracting example to illustrate nonmonotonic reasoning? Probably because the author just couldn't resist getting in a good, solid dig at those hated Greens. It feels so good to get in a hearty punch, y'know, it's like trying to resist a chocolate cookie.
As with chocolate cookies, not everything that feels pleasurable is good for you. And it certainly isn't good for our hapless readers who have to read through all the angry comments your blog post inspired.
It's not quite the same problem, but it has some of the same consequences.
Being able to read off patterns of conditional dependence and independence is an art known as "D-separation", and if you're good at it you can glance at a diagram like this...
In order to get better at this, I recommend downloading and playing around with UnBBayes. Here's a brief video tutorial of the basic usage. The program is pretty buggy - for example, sometimes it randomly refuses to compile a file and then starts working after I close the file and reopen it - but that's more of a trivial inconvenience than a major problem.
What's great about UnBBayes is that it allows you to construct a network and then show how the probability flows around it; you can also force some variable to be true or false and see how this affects the surrounding probabilities. For example, here I've constructed a copy of the "Season" network from the post, filled it with conditional probabilities I made up, and asked the program to calculate the overall probabilities. (This was no tough feat - it took me maybe five minutes, most of which I spent on making up the probabilities.)
http://kajsotala.fi/Random/UnBBayesExample1.png
Let's now run through Eliezer's explanation:
......and see t
That's where I originally found the program. :-)
If you link to that post, you should also update it to mention that I've already written some of those. (#3, #9, #10)
After reading this post I was stunned. Now I think the central conclusion is wrong, though I still think it is a great post, and I will go back to being stunned if you convince me the conclusion is correct.
You've shown how to identify the correct graph structure from the data. But you've erred in assuming that the directed edges of the graph imply causality.
Imagine you did the same analysis, except instead of using O="overweight" you use W="wears size 44 or higher pants". The data would look almost the same. So you would reach an analogous conclusion: that wearing large pants causes one not to exercise. This seems obviously false unless your notion of causality is very different from mine.
In general, I think the following principle holds: inferring causality requires an intervention; it cannot be discovered from observational data alone. A researcher who hypothesized that W causes not-E could round up a bunch of people, have half of them wear big pants, observe the effect of this intervention on exercise rates, and then conclude that there is no causal effect.
You are correct -- directed edges do not imply causality by means of only conditional independence tests. You need something called the faithfulness assumption, and additional (causal) assumptions, that Eliezer glossed over. Without causal assumptions and with only faithfulness, all you are recovering is the structure of a statistical, rather than a causal model. Without faithfulness, conditional independence tests do not imply anything. This is a subtle issue, actually.
There is no magic -- you do not get causality without causal assumptions.
(summary)
Correlation does not imply causation,
but
causation implies correlation,
and therefore
no correlation implies no causation
...which permits the falsification of some causal theories based on the absence of certain correlations.
Absolutely! In a typical Bayesian network, we represent a set of probability distributions by a directed acyclic graph, such that any distribution in the set can be written as
in other words, for every random variable in the distribution we associate a node in the graph, and the distribution can be factorized into a product of conditional densities, where each conditional is a variable (node) conditional on variables corresponding to parents of the node.
This implies that if certain types of paths in the graph from a node set X to a node set Y are "blocked" in a particular way (e.g. d-separated) by a third set Z, then in all densities that factorize as above, X is independent of Y conditional on Z. Note that this implication is one way. In particular, we can still have some conditional independence that just happens to hold because the numbers in the distribution lined up just right, and the graph does not in fact advertise this independence via d-separation. When this happens, we say the distribution is unfaithful to the graph.
If we pick parameters of a distribution that factorizes at random then almost all parameter picks will be faithful to the graph. However, lots ...
Well, in some sense this is why causal inference is hard. Most of the time if you see independence that really does mean there is nothing there. The reasonable default is the null hypothesis: there is no causal effect. However, if you are poking around because you suspect there is something there, then not seeing any correlations does not mean you should give up. What it does mean is you should think about causal structure and specifically about confounders.
What people do about confounders is:
(a) Try to measure them somehow (epidemiology, medicine). If you can measure confounders you can adjust for them, and then the effect cancellation will go away.
(b) Try to find an instrumental variable (econometrics). If you can find a good instrument, you can get a causal effect with some parametric assumptions, even if there are unmeasured confounders.
(c) Try to randomize (statistics). This explicitly cuts out all confounding.
(d) You can sometimes get around unmeasured confounders by using strong mediating variables by means of "front-door" type methods. These methods aren't really well known, and aren't commonly used.
There is no royal road: getting rid of confounders is the...
Pretty good overall, but downvoted due to the inflammatory straw-manning of the physics diet. That kind of sloppy thinking just makes me think you have big blind-spots in your rationality. Maybe it's wrong, but it really has nothing to do with virtue or should-universes. To suggest otherwise is dishonest and rude. I usually don't care about rude, but this pissed me off.
I strongly agree with Vaniver's take
Pretty good overall, but downvoted due to the inflammatory straw-manning of the physics diet. That kind of sloppy thinking just makes me think you have big blind-spots in your rationality. Maybe it's wrong, but it really has nothing to do with virtue or should-universes. To suggest otherwise is dishonest and rude. I usually don't care about rude, but this pissed me off.
I have to admit it seemed entirely the wrong place for Eliezer to be dragging up his health issues. I find it really hard to keep reading a post once it starts throwing out petulant straw men. It's a shame because causality and inference is something Eliezer does probably knows something about.
I recall reading some lovely quote on this (from somebody of the old camp, who believed that talk of 'causality' was naive), but I couldn't track it down in Pearl or on Google - if anyone knows of a good quote from the old school, may it be provided.
Maybe it's this one?
The law of causality, I believe, like much that passes muster among philosophers, is a relic of a bygone age, surviving, like the monarchy, only because it is erroneously supposed to do no harm. (Russell, 1913, p. 1).
It should be noted that Russell later reversed his skepticism about causality.
This is absolutely incredible. As a broadly numerate person who's never studied stats, I literally did not know that this could be done and while I'd heard about ways to work out what caused what from statistical information I thought they had to have far more assumptions in them. I'm slightly distressed that I studied A level Maths and don't know this, given that the concept at least can be taught in twenty minutes judging by the post and is massively open to testing (I thought this post didn't make sense at first and that there were other interpretations of the data, but when I expressed those in the terminology set out it because clear I was wrong.
Seriously, thanks.
I saw no discernible effect on my weight or my musculature
How did you ascertain possible effects on your musculature? If you used the inter-ocular trauma test, keep in mind that gradual changes in something you look at every day (e.g. yourself, a roommate, or a classmate/coworker) are much harder to discern that way. Did you try asking someone who hadn't seen you in a while, or comparing two photos of you taken a couple months apart?
Leaving only this causal graph:
Well, one hasn't ruled out the "virtuous" graph
until one computes that exercise and internet have a correlation.
By the pigeonhole principle (you can't fit 3 pigeons into 2 pigeonholes) there must be some joint probability distributions which cannot be represented in the first causal structure
Although this is a valid interpretation of the Pigeonhole Principle (PP) for some particular one-to-one cases, I think it misses the main point of it as relates to this particular example. You absolutely can fit 3 Pigeons into 2 Pigeonholes, and the standard (to my knowledge) intended takeaway from the PP is that you are gonna have to, if you want your pigeons holed. There might just not be a cute way to do it.
The idea being that in finite sets and with there is no injective from to (you could see this as losing information); but you absolutely can send things from to , you just have to be aware that at least two originally (in ) different elements are going to be mapped onto the same element in . This is an issue of losing uniqueness in the representation, not impossibility of the representation itself. It is even useful sometimes.
A priori, it looks possible for a functio...
" [1] Somewhat to my own shame, I must admit to ignoring my own observations in this department - even after I saw no discernible effect on my weight or my musculature from aerobic exercise and strength training 2 hours a day 3 times a week, I didn't really start believing that the virtue theory of metabolism was wrong [2] until after other people had started the skeptical dogpile."
I am extremely skeptical of this portion, it would imply that Eliezer's body functions differently then literally every other person (myself included) I have ever known to make a serious attempt at working out.. 2 Hours 3 times a week? How long did you try this?
Since you seem to have forgotten what you were arguing, let us review. Eliezer wrote:
I saw no discernible effect on my weight or my musculature from aerobic exercise and strength training 2 hours a day 3 times a week
You wrote:
it would imply that Eliezer's body functions differently then literally every other person (myself included) I have ever known
And implied it must be impossible, hence Eliezer must be doing something wrong.
I linked a study showing that people 'doing it right' could see their fitness go down, empirically refuting your universalizing claim that "every other person (myself included)" would see their fitness only go up.
You then tried to wave away the study by a fully general counter-argument appealing to other factors explaining why some people could see their fitness decrease... But neither I nor Eliezer ever made an argument about what caused the exercise resistance, merely that some people would empirically see their fitness decrease or remain stable.
When I pointed this out, you smarmily replied about how I'm being unfair to you and strawmanning you, and implied that I hold theories of exercise as "magic".
Personally, I see no need to...
But the third model, in which recessions directly cause alarms, which only then cause burglars, does not have this property.
This is not the third model in your picture.
I recall reading some lovely quote on this (from somebody of the old camp, who believed that talk of 'causality' was naive), but I couldn't track it down in Pearl or on Google - if anyone knows of a good quote from the old school, may it be provided.
You thinking of this maybe, quoted in the Epilogue in Pearl's Causality?
Beyond such discarded fundamentals as 'matter' and 'force' lies still another fetish among the inscrutable arcana of modern science, namely, the category of cause and effect.
That's Karl Pearson, as in "Pearson's r", the correlation coefficient.
Causal networks have another name in computer science, in the context of compilers. They're the dataflow diagrams of loop-free array-free non-recursive functions represented in SSA form. (Functions that contain loops, arrays and recursion can still be reasoned about with causal networks, but only locally - you have to unroll everything, and that blows up quickly if you try to do it globally.)
A dataflow diagram is when you give each variable in a function a node, and draw an edge from the variable to each of the other variables that was used in its definiti...
This slammed into my "math is hard" block. I will return and read it, but it's going to be work.
But on pondering that, I think I realized why math is hard, compared to prose text that just presents itself as a fait accompli to my attention. (And why it is not hard, for some people who are savants.)
We are not executing mathematical computations. We are emulating a crude mathematical computer which takes the kind of explicit algorithms that are fed to students. No attempt is made to cultivate and tune a "feel" for the result (which is wha...
[1] Somewhat to my own shame, I must admit to ignoring my own observations in this department - even after I saw no discernible effect on my weight or my musculature from aerobic exercise and strength training 2 hours a day 3 times a week, I didn't really start believing that the virtue theory of metabolism was wrong [2] until after other people had started the skeptical dogpile.
Oh, speaking of which, I was amused the other day by http://well.blogs.nytimes.com/2012/10/10/are-you-likely-to-respond-to-exercise/ Apparently now there's even SNPs linked to non-response...
Well, that suggests that the probability of using Reddit, given that your weight is normal, is the same as the probability that you use Reddit, given that you're overweight. 47,222 out of 334,366 normal-weight people use Reddit, and 12,240 out of 88,376 overweight people use Reddit. That's about 14% either way
Nitpick, but I had busted out Excel at this point, and this is actually 16% either way.
It is obviously impossible to do the converse experiment where half the subjects are randomly assigned lower weights, since there's no known intervention which can cause weight loss.
There is exactly one such intervention that has been shown to cause persistent weight loss after the intervention period is over. (Starvation also causes weight loss, eventually, but only during the intervention period.)
I think it would be valuable if someone pointed out that a third party watching, without controlling, a scientist's controlled study is in pretty much the same situation as the three-column exercise/weight/internet use situation - they have instead exercise/weight/control group.
This "observe the results of a scientist's controlled study" thought experiment motivates and provides hope that one can sometimes derive causation from observation, where the current story arc makes a sortof magical leap.
This is great!
Tpyos:
Shortly after the sentence, "We could consider three hypothetical causal diagrams over only these two variables", one of the "Earthquake --> Recession" tables gives p(¬e) as 0.70 when it should be 0.71 (so it and 0.29 sum to one).
After the sentence, "So since all three variables are correlated, can we distinguish between, say, these three causal models?", this diagram I think is meant to have "Recession" on top and "Burglar" on the bottom. (Vaniver also noticed this one.)
Edit:...
If we know that there's a burglar, then we think that either an alarm or a recession caused it; and if we're told that there's an alarm, we'd conclude it was less likely that there was a recession, since the recession had been explained away.
Is this to say that a given node/observation/fact can only have one cause?
More concretely, lets say we have nodes x, y, and z, with causation arrows from x to z and from y to z.
.X...........Y
...\......./
.......Z
If z is just an "and" logic gate, that outputs a "True" value only w...
I don't post here much (yet), and normally I feel fairly confident in my understanding of basic probability...
But I'm slightly lost here. "if the Sidewalk is Slippery then it is probably Wet and this can be explained by either the Sprinkler or the Rain but probably not both, i.e. if we're told that it's Raining we conclude that it's less likely that the Sprinkler was on." This sentence seems... Wrong. If we're told that it's Raining, we conclude that the chances of Sprinkler is... Exactly the same as it was before we learned that the sidewalk was...
I think you've missed an important piece of this picture, or perhaps have not emphasized it as much as I would. The real real reason we can elucidate causation from correlation is that we have a prior that prefers simple explanations over complex ones, and so when some observed frequencies can be explained by a compact (simple) bayes net we take the arrows in that bayes net to be causation.
A fully connected bayes net (or equivalently, a causal graph with one hidden node pointing to all observed nodes) can represent any probability distribution whatsoever. ...
Somewhat to my own shame, I must admit to ignoring my own observations in this department - even after I saw no discernible effect on my weight or my musculature from aerobic exercise and strength training 2 hours a day 3 times a week, I didn't really start believing that the virtue theory of metabolism was wrong until after other people had started the skeptical dogpile.
Wait, are you saying that aerobic exercise and strength training don't have any significant effect on weight?
A person that I trust to be truthful, and who has done research on this topic, has pointed out to me that muscle has a higher density than fat. So if you experience, simultaneously, both an increase in muscle and a decrease in fat, then your weight may very well not change (or even increase, depending on the amount of muscle).
The same person tells me that exercise both increases muscle and decreases fat.
I understand your suspicion, and I don't think you're being too harsh at all. Scepticism on this point is more likely to improve understanding, after all.
There are ways to measure fat independantly of weight, however. The electrical conductance of fat and muscle differs - you can get scales that will measure both your weight and your conductance, and present you with a figure describing what percentage of your body weight is due to fat. There's also a machine at my local gym that purports to measure body fat percentage (I'm not entirely sure how it works or how accurate it is), and I have found that if I fail to exercise over a long period of time, then the figure that it measures shows a general upwards trend.
All these conclusions seem to require simultaneity of causation. If earthquakes almost always caused recessions, but not until one year after the earthquake; and if recessions drastically increase the number of burglars, but not until one year after the recession; then drawing any of the conclusions you made from a survey taken at a single point in time would be entirely unwarranted. Doesn't that mean you’re essentially measuring entailment rather than causation via a series of physical events which take time to occur?
Also, the virtue theory of metabolis...
A few minor clarity/readability points:
- The second paragraph opening "The statisticians who discovered the nature of reality" reads rather oddly when taken out of the context of "The Fabric of Real Things".
- When considering the three causal models of Burglars, Alarms and Recessions, tackling the models in a "First, third, second" order threw me on first reading. It would probably be easier to follow if the text and the diagram used the same order.
- Perhaps giving each node a different pastel colour would make it easier to foll
I followed most of the math but the part right before
multiplying together the conditional probability of each variable given the values of its immediate parents. (If a node has no parents, the probability table for it has just an unconditional probability, like "the chance of an earthquake is .01".)
has me puzzled. The variables used aren't explicitly mentioned elsewhere in the article, and while I think they have some conventional meaning I can't quiet remember what. The context let me make a decent guess, but I still feel a little fuzzy. Otherwise the post was pretty clear, much clearer than the other explanations I've seen.
Here is a spreadsheet with all the numbers for the Exercise example all crunched and the graph reasoning explained in a slightly different manner:
https://docs.google.com/spreadsheet/ccc?key=0ArkrB_7bUPTNdGhXbFd3SkxWUV9ONWdmVk9DcVRFMGc&usp=sharing
I think I spotted a mistake. I'm surprised no one noticed it earlier.
Eliezer says the data shows that Overweight and Internet both make exercise less likely.
That would imply that P(O|I & not E) should be less than P(O|not E); and that P(I|O & not E) should be less than P(I|not E). But actually, they're approximately equal![1]
| P(not E) | 0.6039286373 |
| P(not E & O) | 0.1683130609 |
| P(not E & I) | 0.09519044713 |
| P(I & O & not E) | 0.02630682544 |
| P(I|not E) | 0.1576187007 |
| P(I|not E & O) | 0.1562969938 |
| P(O|not E) | 0.2786969362 |
| P(O|not E & I) | 0.2763599314 |
(From the...
(We have remnants of this type of reasoning in old-school "Correlation does not imply causation", without the now-standard appendix, "But it sure is a hint".)
Given the reasoning in this post and this post I think you can also infer that this old "Correlation does not imply causation" statement is not only flawed, but it's also outright wrong
And should instead just be "Correlation does imply causation, but doesn't tell which kind"
Let's consider a practical example. Since the question of exercise and weight has turned up, let's revisit it. First, let's collect some raw data (I can't use internet usage, since this poll is extremely biased on that axis).
For the purposes of this poll, "overweight" means a body mass index over 25. "Exercise" means at least 30 minutes a week, working hard at it, on a regular basis. "Diet" means that you actually think about the nutritional value of the food you eat, and consciously base your choice of food on that informatio...
So, what if the causal diagram isn't simply dependent and/or contains loops? What if recessions cause burglars, and burglars disable alarms, and alarms cause recessions?
You also forgot about the graph that has confounding factors C and D; C affects exercise and weight, while D affects exercise and internet usage. Both of them make exercise more (or less) likely, and their other factor less (or more) likely; Weight and internet use remain uncorrelated, but remain negatively correlated with exercise.
Very nice and intuitive, thanks! This explanation is great.
(Though I've already spent a little while playing around with Bayes nets, and I don't know how large of a role that had in making this feel more intuitive to me.)
Currently it looks like this page has lots of broken images, which are actually formulas. Can this be fixed? It's kind of hard to understand now.
If we know that there's a burglar, then we think that either an alarm or a recession caused it; and if we're told that there's an alarm, we'd conclude it was less likely that there was a recession, since the recession had been explained away.
Should that be "since the burglar had been explained away"? Or am I confused?
Edit: I was confused. The burglar was explained; the recession was explained away.
I've been enjoying this series so far, and I found this article to be particularly helpful. I did have a minor suggestion. The turnstile and the logical negation symbols were called out, and I thought it might be useful to explicitly breakdown the probability distribution equation. The current Less Wrong audience had little problem with it, certainly, but if you were showing it to someone new to this for the first time, they might not be acquainted with it. I was thinking something along the lines of this from stattrek:
"Generally, statisticians use a ...
This helped me understand what Instrumental Variables are, but Andrew Gelman's critique of instrumental variables has me confused again:
...Suppose z is your instrument, T is your treatment, and y is your outcome. So the causal model is z -> T -> y. The trick is to think of (T,y) as a joint outcome and to think of the effect of z on each. For example, an increase of 1 in z is associated with an increase of 0.8 in T and an increase of 10 in y. The usual “instrumental variables” summary is to just say the estimated effect of T on y is 10/0.8=12.5, but I’
Interesting article, thanks.
I agree with the general concept. I would be a bit more careful in the conclusions, however:
No visible correlation does not mean no causation - it is just a strong hint. In the specific example, the hint comes from a single parameter - the lack of significant correlation between internet & overweight when both exercise categories are added; together with the significant correlation of internet usage with the other two parameters.
With the proposed diagram, I get:
p(Internet)=.141
p(not Internet)=.859
p(Overweight)=.209
p(not Over...
I haven't read enough of Causality, but I think I get how to find a causal model from the examples above.
Basically, a model selection problem? P(Model|Data) = P(Data|Model)P(Model)/P(Data) ~ P(Data|Model)P(Model)?
Is P(Model) done in some objective sense, or is that left to the prior of the modeler? Or some combination of contextually objective and standard causal modeling priors (direction of time, locality, etc.)?
Any good powerpoint summary of Pearl's methods out there?
An earthquake is 0.8 likely to set off your burglar alarm; a burglar is 0.9 likely to set off your burglar alarm. And - we can't compute this model fully without this info - the combination of a burglar and an earthquake is 0.95 likely to set off the alarm;
I don't think that true. The earthquake can cause the burgler to have less control over his own movement and therefore increase the chance that he triggers the alarm.
This was a really good article overall; I just finished going through all the numbers in Excel and it makes a lot of sense.
The thing that is most counterintuitive to me is that it appears that the causal link between exercise and weight can ONLY be computed if you bring in a 3rd, seemingly irrelevant variable like internet usage. It looks like that variable has to be somehow correlated with at least one of the causal nodes - maybe it has to be correlated with one specific node... I am a little hazy on that.
I encourage readers to open an Excel file or somet...
Early investigators in Artificial Intelligence, who were trying to represent all high-level events using primitive tokens in a first-order logic (for reasons of historical stupidity we won't go into) were stymied by the following apparent paradox:
[Description of a system with the following three theorems: ⊢ ALARM → BURGLAR, ⊢ EARTHQUAKE → ALARM, and ⊢ (EARTHQUAKE & ALARM) → NOT BURGLAR]
Which represents a logical contradiction.
This isn't a logical contradiction: perhaps what you mean is that we can deduce from this system that EARTHQUAKE is false. Th...
The concern of the philosophers is the idea of 'true causation' as independent from merely apparent causation. In particular, they have in mind the idea that even if the laws of the universe were deterministic there would be a sense in which certain events could be said to be causes of others even though mathematically, the configuration of the universe at any time completely entails it at all others. Frankly, this question arises out of half-baked arguments about whether events cause latter events or if god has predetermined and causes all events indivi...
Suppose a general-population survey shows that people who exercise less, weigh more. You don't have any known direction of time in the data - you don't know which came first, the increased weight or the diminished exercise. And you didn't randomly assign half the population to exercise less; you just surveyed an existing population.
The statisticians who discovered causality were trying to find a way to distinguish, within survey data, the direction of cause and effect - whether, as common sense would have it, more obese people exercise less because they find physical activity less rewarding; or whether, as in the virtue theory of metabolism, lack of exercise actually causes weight gain due to divine punishment for the sin of sloth.
vs.
The usual way to resolve this sort of question is by randomized intervention. If you randomly assign half your experimental subjects to exercise more, and afterward the increased-exercise group doesn't lose any weight compared to the control group [1], you could rule out causality from exercise to weight, and conclude that the correlation between weight and exercise is probably due to physical activity being less fun when you're overweight [3]. The question is whether you can get causal data without interventions.
For a long time, the conventional wisdom in philosophy was that this was impossible unless you knew the direction of time and knew which event had happened first. Among some philosophers of science, there was a belief that the "direction of causality" was a meaningless question, and that in the universe itself there were only correlations - that "cause and effect" was something unobservable and undefinable, that only unsophisticated non-statisticians believed in due to their lack of formal training:
"The law of causality, I believe, like much that passes muster among philosophers, is a relic of a bygone age, surviving, like the monarchy, only because it is erroneously supposed to do no harm." -- Bertrand Russell (he later changed his mind)
"Beyond such discarded fundamentals as 'matter' and 'force' lies still another fetish among the inscrutable arcana of modern science, namely, the category of cause and effect." -- Karl Pearson
The famous statistician Fisher, who was also a smoker, testified before Congress that the correlation between smoking and lung cancer couldn't prove that the former caused the latter. We have remnants of this type of reasoning in old-school "Correlation does not imply causation", without the now-standard appendix, "But it sure is a hint".
This skepticism was overturned by a surprisingly simple mathematical observation.
Let's say there are three variables in the survey data: Weight, how much the person exercises, and how much time they spend on the Internet.
For simplicity, we'll have these three variables be binary, yes-or-no observations: Y or N for whether the person has a BMI over 25, Y or N for whether they exercised at least twice in the last week, and Y or N for whether they've checked Reddit in the last 72 hours.
Now let's say our gathered data looks like this:
And lo, merely by eyeballing this data -
(which is totally made up, so don't go actually believing the conclusion I'm about to draw)
- we now realize that being overweight and spending time on the Internet both cause you to exercise less, presumably because exercise is less fun and you have more alternative things to do, but exercising has no causal influence on body weight or Internet use.
"What!" you cry. "How can you tell that just by inspecting those numbers? You can't say that exercise isn't correlated to body weight - if you just look at all the members of the population who exercise, they clearly have lower weights. 10% of exercisers are overweight, vs. 28% of non-exercisers. How could you rule out the obvious causal explanation for that correlation, just by looking at this data?"
There's a wee bit of math involved. It's simple math - the part we'll use doesn't involve solving equations or complicated proofs -but we do have to introduce a wee bit of novel math to explain how the heck we got there from here.
Let me start with a question that turned out - to the surprise of many investigators involved - to be highly related to the issue we've just addressed.
Suppose that earthquakes and burglars can both set off burglar alarms. If the burglar alarm in your house goes off, it might be because of an actual burglar, but it might also be because a minor earthquake rocked your house and triggered a few sensors. Early investigators in Artificial Intelligence, who were trying to represent all high-level events using primitive tokens in a first-order logic (for reasons of historical stupidity we won't go into) were stymied by the following apparent paradox:
If you tell me that my burglar alarm went off, I infer a burglar, which I will represent in my first-order-logical database using a theorem ⊢ ALARM → BURGLAR. (The symbol "⊢" is called "turnstile" and means "the logical system asserts that".)
If an earthquake occurs, it will set off burglar alarms. I shall represent this using the theorem ⊢ EARTHQUAKE → ALARM, or "earthquake implies alarm".
If you tell me that my alarm went off, and then further tell me that an earthquake occurred, it explains away my burglar alarm going off. I don't need to explain the alarm by a burglar, because the alarm has already been explained by the earthquake. I conclude there was no burglar. I shall represent this by adding a theorem which says ⊢ (EARTHQUAKE & ALARM) → NOT BURGLAR.
Which represents a logical contradiction, and for a while there were attempts to develop "non-monotonic logics" so that you could retract conclusions given additional data. This didn't work very well, since the underlying structure of reasoning was a terrible fit for the structure of classical logic, even when mutated.
Just changing certainties to quantitative probabilities can fix many problems with classical logic, and one might think that this case was likewise easily fixed.
Namely, just write a probability table of all possible combinations of earthquake or ¬earthquake, burglar or ¬burglar, and alarm or ¬alarm (where ¬ is the logical negation symbol), with the following entries:
Using the operations of marginalization and conditionalization, we get the desired reasoning back out:
Let's start with the probability of a burglar given an alarm, p(burglar|alarm). By the law of conditional probability,
i.e. the relative fraction of cases where there's an alarm and a burglar, within the set of all cases where there's an alarm.
The table doesn't directly tell us p(alarm & burglar)/p(alarm), but by the law of marginal probability,
Similarly, to get the probability of an alarm going off, p(alarm), we add up all the different sets of events that involve an alarm going off - entries 1, 3, 5, and 7 in the table.
So the entire set of calculations looks like this:
If I hear a burglar alarm, I conclude there was probably (63%) a burglar.
If I learn about an earthquake, I conclude there was probably (80%) an alarm.
I hear about an alarm and then hear about an earthquake; I conclude there was probably (98%) no burglar.
Thus, a joint probability distribution is indeed capable of representing the reasoning-behaviors we want.
So is our problem solved? Our work done?
Not in real life or real Artificial Intelligence work. The problem is that this solution doesn't scale. Boy howdy, does it not scale! If you have a model containing forty binary variables - alert readers may notice that the observed physical universe contains at least forty things - and you try to write out the joint probability distribution over all combinations of those variables, it looks like this:
(1,099,511,627,776 entries)
This isn't merely a storage problem. In terms of storage, a trillion entries is just a terabyte or three. The real problem is learning a table like that. You have to deduce 1,099,511,627,776 floating-point probabilities from observed data, and the only constraint on this giant table is that all the probabilities must sum to exactly 1.0, a problem with 1,099,511,627,775 degrees of freedom. (If you know the first 1,099,511,627,775 numbers, you can deduce the 1,099,511,627,776th number using the constraint that they all sum to exactly 1.0.) It's not the storage cost that kills you in a problem with forty variables, it's the difficulty of gathering enough observational data to constrain a trillion different parameters. And in a universe containing seventy things, things are even worse.
So instead, suppose we approached the earthquake-burglar problem by trying to specify probabilities in a format where... never mind, it's easier to just give an example before stating abstract rules.
First let's add, for purposes of further illustration, a new variable, "Recession", whether or not there's a depressed economy at the time. Now suppose that:
The probability of an earthquake is 0.01.
The probability of a recession at any given time is 0.33 (or 1/3).
The probability of a burglary given a recession is 0.04; or, given no recession, 0.01.
An earthquake is 0.8 likely to set off your burglar alarm; a burglar is 0.9 likely to set off your burglar alarm. And - we can't compute this model fully without this info - the combination of a burglar and an earthquake is 0.95 likely to set off the alarm; and in the absence of either burglars or earthquakes, your alarm has a 0.001 chance of going off anyway.
According to this model, if you want to know "The probability that an earthquake occurs" - just the probability of that one variable, without talking about any others - you can directly look up p(e) = .01. On the other hand, if you want to know the probability of a burglar striking, you have to first look up the probability of a recession (.33), and then p(b|r) and p(b|¬r), and sum up p(b|r)*p(r) + p(b|¬r)*p(¬r) to get a net probability of .01*.66 + .04*.33 = .02 = p(b), a 2% probability that a burglar is around at some random time.
If we want to compute the joint probability of four values for all four variables - for example, the probability that there is no earthquake and no recession and a burglar and the alarm goes off - this causal model computes this joint probability as the product:
In general, to go from a causal model to a probability distribution, we compute, for each setting of all the variables, the product
multiplying together the conditional probability of each variable given the values of its immediate parents. (If a node has no parents, the probability table for it has just an unconditional probability, like "the chance of an earthquake is .01".)
This is a causal model because it corresponds to a world in which each event is directly caused by only a small set of other events, its parent nodes in the graph. In this model, a recession can indirectly cause an alarm to go off - the recession increases the probability of a burglar, who in turn sets off an alarm - but the recession only acts on the alarm through the intermediate cause of the burglar. (Contrast to a model where recessions set off burglar alarms directly.)
vs.
The first diagram implies that once we already know whether or not there's a burglar, we don't learn anything more about the probability of a burglar alarm, if we find out that there's a recession:
This is a fundamental illustration of the locality of causality - once I know there's a burglar, I know everything I need to know to calculate the probability that there's an alarm. Knowing the state of Burglar screens off anything that Recession could tell me about Alarm - even though, if I didn't know the value of the Burglar variable, Recessions would appear to be statistically correlated with Alarms. The present screens off the past from the future; in a causal system, if you know the exact, complete state of the present, the state of the past has no further physical relevance to computing the future. It's how, in a system containing many correlations (like the recession-alarm correlation), it's still possible to compute each variable just by looking at a small number of immediate neighbors.
Constraints like this are also how we can store a causal model - and much more importantly, learn a causal model - with many fewer parameters than the naked, raw, joint probability distribution.
Let's illustrate this using a simplified version of this graph, which only talks about earthquakes and recessions. We could consider three hypothetical causal diagrams over only these two variables:
p(E&R)=p(E)p(R)
p(E&R) = p(E)p(R|E)
p(E&R) = p(R)p(E|R)
Let's consider the first hypothesis - that there's no causal arrows connecting earthquakes and recessions. If we build a causal model around this diagram, it has 2 real degrees of freedom - a degree of freedom for saying that the probability of an earthquake is, say, 29% (and hence that the probability of not-earthquake is necessarily 71%), and another degree of freedom for saying that the probability of a recession is 3% (and hence the probability of not-recession is constrained to be 97%).
On the other hand, the full joint probability distribution would have 3 degrees of freedom - a free choice of (earthquake&recession), a choice of p(earthquake&¬recession), a choice of p(¬earthquake&recession), and then a constrained p(¬earthquake&¬recession) which must be equal to 1 minus the sum of the other three, so that all four probabilities sum to 1.0.
By the pigeonhole principle (you can't fit 3 pigeons into 2 pigeonholes) there must be some joint probability distributions which cannot be represented in the first causal structure. This means the first causal structure is falsifiable; there's survey data we can get which would lead us to reject it as a hypothesis. In particular, the first causal model requires:
or equivalently
or equivalently
which is a conditional independence constraint - it says that learning about recessions doesn't tell us anything about the probability of an earthquake or vice versa. If we find that earthquakes and recessions are highly correlated in the observed data - if earthquakes and recessions go together, or earthquakes and the absence of recessions go together - it falsifies the first causal model.
For example, let's say that in your state, an earthquake is 0.1 probable per year and a recession is 0.2 probable. If we suppose that earthquakes don't cause recessions, earthquakes are not an effect of recessions, and that there aren't hidden aliens which produce both earthquakes and recessions, then we should find that years in which there are earthquakes and recessions happen around 0.02 of the time. If instead earthquakes and recessions happen 0.08 of the time, then the probability of a recession given an earthquake is 0.8 instead of 0.2, and we should much more strongly expect a recession any time we are told that an earthquake has occurred. Given enough samples, this falsifies the theory that these factors are unconnected; or rather, the more samples we have, the more we disbelieve that the two events are unconnected.
On the other hand, we can't tell apart the second two possibilities from survey data, because both causal models have 3 degrees of freedom, which is the size of the full joint probability distribution. (In general, fully connected causal graphs in which there's a line between every pair of nodes, have the same number of degrees of freedom as a raw joint distribution - and 2 nodes connected by 1 line are "fully connected".) We can't tell if earthquakes are 0.1 likely and cause recessions with 0.8 probability, or recessions are 0.2 likely and cause earthquakes with 0.4 probability (or if there are hidden aliens which on 6% of years show up and cause earthquakes and recessions with probability 1).
With larger universes, the difference between causal models and joint probability distributions becomes a lot more striking. If we're trying to reason about a million binary variables connected in a huge causal model, and each variable could have up to four direct 'parents' - four other variables that directly exert a causal effect on it - then the total number of free parameters would be at most... 16 million!
The number of free parameters in a raw joint probability distribution over a million binary variables would be 21,000,000. Minus one.
So causal models which are less than fully connected - in which most objects in the universe are not the direct cause or direct effect of everything else in the universe - are very strongly falsifiable; they only allow probability distributions (hence, observed frequencies) in an infinitesimally tiny range of all possible joint probability tables. Causal models very strongly constrain anticipation - disallow almost all possible patterns of observed frequencies - and gain mighty Bayesian advantages when these predictions come true.
To see this effect at work, let's consider the three variables Recession, Burglar, and Alarm.
All three variables seem correlated to each other when considered two at a time. For example, if we consider Recessions and Alarms, they should seem correlated because recessions cause burglars which cause alarms. If we learn there was an alarm, for example, we conclude it's more probable that there was a recession. So since all three variables are correlated, can we distinguish between, say, these three causal models?
Yes we can! Among these causal models, the prediction which only the first model makes, which is not shared by either of the other two, is that once we know whether a burglar is there, we learn nothing more about whether there was an alarm by finding out that there was a recession, since recessions only affect alarms through the intermediary of burglars:
But the third model, in which recessions directly cause alarms, which only then cause burglars, does not have this property. If I know that a burglar has appeared, it's likely that an alarm caused the burglar - but it's even more likely that there was an alarm, if there was a recession around to cause the alarm! So the third model predicts:
And in the second model, where alarms and recessions both cause burglars, we again don't have the conditional independence. If we know that there's a burglar, then we think that either an alarm or a recession caused it; and if we're told that there's an alarm, we'd conclude it was less likely that there was a recession, since the recession had been explained away.
(This may seem a bit clearer by considering the scenario B->A<-E, where burglars and earthquakes both cause alarms. If we're told the value of the bottom node, that there was an alarm, the probability of there being a burglar is not independent of whether we're told there was an earthquake - the two top nodes are not conditionally independent once we condition on the bottom node.)
On the other hand, we can't tell the difference between:
vs.
vs.
using only this data and no other variables, because all three causal structures predict the same pattern of conditional dependence and independence - three variables which all appear mutually correlated, but Alarm and Recession become independent once you condition on Burglar.
Being able to read off patterns of conditional dependence and independence is an art known as "D-separation", and if you're good at it you can glance at a diagram like this...
...and see that, once we already know the Season, whether the Sprinkler is on and whether it is Raining are conditionally independent of each other - if we're told that it's Raining we conclude nothing about whether or not the Sprinkler is on. But if we then further observe that the sidewalk is Slippery, then Sprinkler and Rain become conditionally dependent once more, because if the Sidewalk is Slippery then it is probably Wet and this can be explained by either the Sprinkler or the Rain but probably not both, i.e. if we're told that it's Raining we conclude that it's less likely that the Sprinkler was on.
Okay, back to the obesity-exercise-Internet example. You may recall that we had the following observed frequencies:
Do you see where this is going?
"Er," you reply, "Maybe if I had a calculator and ten minutes... you want to just go ahead and spell it out?"
Sure! First, we marginalize over the 'exercise' variable to get the table for just weight and Internet use. We do this by taking the 1,119 people who are YYY, overweight and Reddit users and exercising, and the 11,121 people who are overweight and non-exercising and Reddit users, YNY, and adding them together to get 12,240 total people who are overweight Reddit users:
"And then?"
Well, that suggests that the probability of using Reddit, given that your weight is normal, is the same as the probability that you use Reddit, given that you're overweight. 47,222 out of 334,366 normal-weight people use Reddit, and 12,240 out of 88,376 overweight people use Reddit. That's about 14% either way.
"And so we conclude?"
Well, first we conclude it's not particularly likely that using Reddit causes weight gain, or that being overweight causes people to use Reddit:
If either of those causal links existed, those two variables should be correlated. We shouldn't find the lack of correlation or conditional independence that we just discovered.
Next, imagine that the real causal graph looked like this:
In this graph, exercising causes you to be less likely to be overweight (due to the virtue theory of metabolism), and exercising causes you to spend less time on the Internet (because you have less time for it).
But in this case we should not see that the groups who are/aren't overweight have the same probability of spending time on Reddit. There should be an outsized group of people who are both normal-weight and non-Redditors (because they exercise), and an outsized group of non-exercisers who are overweight and Reddit-using.
So that causal graph is also ruled out by the data, as are others like:
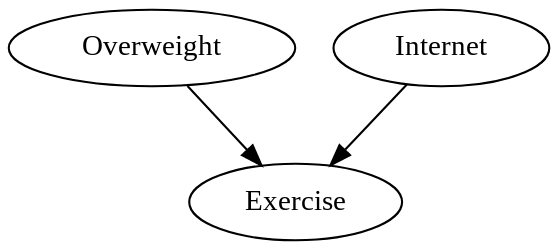
Leaving only this causal graph:
Which says that weight and Internet use exert causal effects on exercise, but exercise doesn't causally affect either.
All this discipline was invented and systematized by Judea Pearl, Peter Spirtes, Thomas Verma, and a number of other people in the 1980s and you should be quite impressed by their accomplishment, because before then, inferring causality from correlation was thought to be a fundamentally unsolvable problem. The standard volume on causal structure is Causality by Judea Pearl.
Causal models (with specific probabilities attached) are sometimes known as "Bayesian networks" or "Bayes nets", since they were invented by Bayesians and make use of Bayes's Theorem. They have all sorts of neat computational advantages which are far beyond the scope of this introduction - e.g. in many cases you can split up a Bayesian network into parts, put each of the parts on its own computer processor, and then update on three different pieces of evidence at once using a neatly local message-passing algorithm in which each node talks only to its immediate neighbors and when all the updates are finished propagating the whole network has settled into the correct state. For more on this see Judea Pearl's Probabilistic Reasoning in Intelligent Systems: Networks of Plausible Inference which is the original book on Bayes nets and still the best introduction I've personally happened to read.
[1] Somewhat to my own shame, I must admit to ignoring my own observations in this department - even after I saw no discernible effect on my weight or my musculature from aerobic exercise and strength training 2 hours a day 3 times a week, I didn't really start believing that the virtue theory of metabolism was wrong [2] until after other people had started the skeptical dogpile.
[2] I should mention, though, that I have confirmed a personal effect where eating enough cookies (at a convention where no protein is available) will cause weight gain afterward. There's no other discernible correlation between my carbs/protein/fat allocations and weight gain, just that eating sweets in large quantities can cause weight gain afterward. This admittedly does bear with the straight-out virtue theory of metabolism, i.e., eating pleasurable foods is sinful weakness and hence punished with fat.
[3] Or there might be some hidden third factor, a gene which causes both fat and non-exercise. By Occam's Razor this is more complicated and its probability is penalized accordingly, but we can't actually rule it out. It is obviously impossible to do the converse experiment where half the subjects are randomly assigned lower weights, since there's no known intervention which can cause weight loss.
Mainstream status: This is meant to be an introduction to completely bog-standard Bayesian networks, causal models, and causal diagrams. Any departures from mainstream academic views are errors and should be flagged accordingly.
Part of the sequence Highly Advanced Epistemology 101 for Beginners
Next post: "Stuff That Makes Stuff Happen"
Previous post: "The Fabric of Real Things"