Comment Permalink
40
Probably gotten most of the responses it was going to get, so here's a scatter plot:
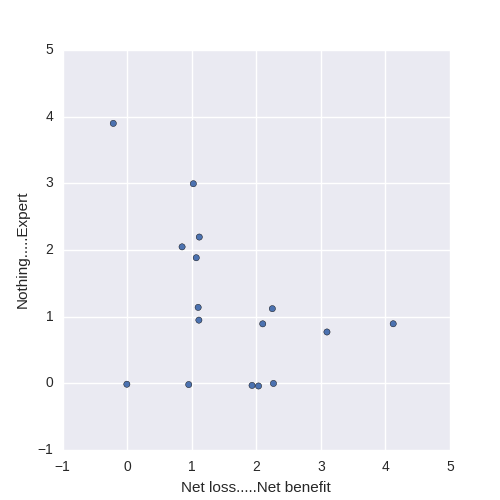
People seem to think it's worse the more they know about it (except those who know nothing seem slightly more pessimistic than those who know only a little).
Made by running this in IPython (after "import pandas as pd" and "from numpy.random import randn" in .pythonstartup):
!sed "/^#/d" poll.csv >poll-clean.csv
pd.read_csv("poll-clean.csv", names=["user", "pollid", "response", "date"])
_.pivot_table("response", ["user"], ["pollid"])
_ + 0.1*randn(*_.shape) # jitter
_.plot(kind="scatter", x=906, y=907)
plt.xlabel("Net loss.....Net benefit")
plt.ylabel("Nothing.....Expert")
If it's worth saying, but not worth its own post (even in Discussion), then it goes here.
Notes for future OT posters:
1. Please add the 'open_thread' tag.
2. Check if there is an active Open Thread before posting a new one. (Immediately before; refresh the list-of-threads page before posting.)
3. Open Threads should be posted in Discussion, and not Main.
4. Open Threads should start on Monday, and end on Sunday.