To communicate risks, we often turn to stories. Nuclear weapons conjure stories of mutually assured destruction, briefcases with red buttons, and nuclear winter. Climate change conjures stories of extreme weather, cities overtaken by rising sea levels, and crop failures. Pandemics require little imagination after COVID, but were previously the subject of movies like Contagion.
Stories are great for conveying concrete risks (I myself recently did this for AI risks), but they’re a bad way to predict the future. That’s because most stories are far too specific to be probable. More importantly, stories tend to feature short, simple chains of causation while reality is complex and multi-causal.
Instead of using stories, most competitive forecasters start their forecasts by looking at historical reference classes. This works really well, and also makes sense: history pulls us away from the biases of story-telling by grounding in events that actually occurred. While history is filtered through narratives, a good history will contend with the complexity of reality, and we can further strip away narrative by grounding in raw numbers.[1]
In this post, I’ll use reference classes to understand the largest risks society faces today. I’ll do this by considering two different reference classes for historical catastrophes:
Events that killed a significant fraction of the global human population (Section 1)
Extinctions of species, and especially mass extinction events (Section 2)
Looking at these reference classes teaches us two things. First, it gives us a numerical estimate of how rare different catastrophes are. If we define a catastrophe as an event killing 1% of the global population within a decade, then 11 such catastrophes have occurred since 1500, for a base rate of 2% per year. If we raise the bar to killing 10% of the population, the base rate drops by an order of magnitude, to 0.2%.
History also gives us qualitative insights. For instance, all the catastrophes in the previous paragraph were epidemics, wars, or famines. Further, many events were multi-causal—the worst epidemics occurred when populations were already weakened by famine, and many epidemics and famines were precipitated by changes in climate or by political turmoil. Species extinctions are also multi-causal, and the common culprits are climate change, natural disasters, invasive species, and humans.
One argument against using historical base rates is that the present is so different from the past (e.g. due to technology) that base rates are meaningless. While today’s world is indeed different from the past, base rates can help sharpen rather than neglect these differences, by clarifying what’s actually new. For instance, the mere presence of technology cannot move us far above the base rate, because many technologies have been developed throughout history and none has caused a catastrophe in the sense defined above. Instead, we should look for technology that shares properties with the historical drivers of catastrophe: epidemics, famines, wars, political turmoil, climate changes, natural disasters, invasive species, and humans.
I analyze these drivers in detail (Section 3), and find that they fall into a few core groups:
Natural events that are global or regional in scale (famines, climate change, natural disasters)
Coordinated groups of humans seeking resources, land, or power (wars, political turmoil, extinctions due to overhunting and habitat destruction)
This list makes sense—to have a global impact, something should either start out with a global scale (large natural events), or have a means to get there (self-replication, coordination).
From this perspective, what are the possible drivers of catastrophe in the 21st century? Some answers are obvious from the list above—pandemics, climate change, and major wars continue to be serious threats. Famines are less obviously threatening, as the last major one was in 1961, but preparing for them may still be prudent. And political turmoil, when not itself catastrophic, creates the conditions for other catastrophes to occur.
Turning to new technologies, engineered pathogens are dangerous because they are novel self-replicators, as are certain types of nanotech. Nuclear weapons are dangerous because they have similar effects to natural disasters, and because they increase the worst-case damage from war.
Finally, AI (my own area of study) unfortunately has properties in common with many drivers of catastrophe. It is a novel self-replicator (it can copy itself) that can quickly adapt to new data. AI systems can be trained to coordinate and may seek power, mirroring the threat of coordinated groups of humans. Finally, AI may exacerbate other drivers of catastrophe if it leads to economic unrest and subsequent political turmoil.
Historical Causes of Human Population Loss
To start our analysis, I looked at the largest historical causes of human population loss, as measured by the fraction of the global population that was killed by a given event. To do so, I combined data from the Wikipedia lists of major wars, slavery and other forced labor, famines, epidemics, and natural disasters. I considered other data sources such as technological disasters, but all of these had much smaller death tolls than the five above. The main exception is genocides, as these often co-occurred with wars and are already included in those death tolls, so I excluded them to avoid double-counting.
I wrote a Python script (shared in the Appendix) to scrape these sources and aggregate them into a single Pandas dataframe, then filtered to create two datasets:
Catastrophes: all events that killed at least 0.1% of the human population, calculated by dividing total deaths by the world population at the start of the event.[2][3]
Strict catastrophes: I further restrict to events that are “fast” (last less than a decade) and in which at least 1% of the human population died.
The set of catastrophes comprises 85 events, of which 80 occurred since 0 CE, and of which 33 were wars, 28 were famines, 15 were epidemics, 6 were forced labor, and 3 were natural disasters. The strict catastrophes comprise 17 events: 5 wars, 8 famines, and 4 epidemics. I include the complete list of strict catastrophes below, as well as a scatter plot of all catastrophes (see the Appendix for raw data).
In addition to these historical events, two important prehistoric events are the Toba catastrophe (97% drop in human population, possibly due to a supervolcano) and the 4.2kya event (likely led to global famines, but death toll is unclear).
Reporting bias and base rates. There is very likely reporting bias, as we see the rate of catastrophes “increase” in the 1500s and again in the 1900s, and this happens for all categories including famines (which should decrease over time with better technology). If we start from 1500, there have been 51 catastrophes (0.11/year), and 11 strict catastrophes (0.02/year).
Let’s next model how the base rate of (fast) catastrophes[4] varies with their severity. Looking at all catastrophes that lead to at least a 1% population drop, we see an approximately Zipfian distribution: the probability of a catastrophe with a death rate of r is proportional to 1/r.
Based on this, catastrophes with 10% death rates have an incidence of 0.002/year (once per 5 centuries) and those with a 1% death rate occur 0.02/year (twice per century). While these numbers might seem low, they imply that there is about a 5% chance of a 10%-death-rate catastrophe in the next 25 years (since 0.002 * 25 = 0.05).
Below 1% death rates, catastrophes are less likely than Zipf’s law predicts (see Appendix). For instance, the empirical frequency for 0.1% death rates is 0.08/year (slightly less than once per decade).
Trends over time. If we count the catastrophes in each decade since 1500, we obtain the following plot:
There were many more catastrophes in the period 1850-1950, although I suspect this is an artifact of reporting bias. Prior to this period, the rate of catastrophes appears roughly constant over time: neither a Ljung-Box test nor a Wald-Wolfowitz test is able to reject the null that catastrophes were identically distributed across decades from 1500-1900 (p=0.36 and 0.26, respectively).
The most notable change over time is the calm period that we are currently in, starting around 1950-1960. Indeed, catastrophes decreased significantly since the first half of the 20th century:
9 famines occurred in the first half of the 20th century but only 1 occurred in the second half (Great Chinese Famine, 1959-1961)
5 major wars occurred in the first half but only 1 occurred in the second half (Korean War, 1950-1953)
Epidemics were more constant, with 2 in the first half and 1 in the second half (plus COVID in 2019).
Famines plausibly decreased due to better food production and storage, which is hopefully a lasting improvement. Wars probably decreased due to the Pax Americana, but that unfortunately may now be unwinding with growing global tensions. Thus epidemics and (possibly) wars are the main modern sources of catastrophe so far.
Qualitative analysis: multi-causality. Many catastrophes have multiple causes. For instance, in the predominant theory of the Black Death, climate change was a driver in two ways. First, climate change in Asia led rodents to migrate from mountainous areas to more populated regions, spreading the disease. Second, the Little Ice Age in Europe led to famines, causing populations to be weak and thus more susceptible to disease.[5] Interestingly, the Black Death may have also intensified the Little Ice Age by causing reforestation where populations decreased, leading to carbon capture and subsequent cooling.
To give several other examples of multiple causes:
In the European colonization of the Americas, most deaths were due to disease rather than war.
The transition from Ming to Qing was caused by many factors, including disease and famine; the famine itself was possibly caused by the Little Ice Age.
The Taiping Rebellion was started due to political unrest from famine, and many of the subsequent deaths were caused by drought, famine, and disease rather than military fatalities.
In general, many famines were caused by climatic events and/or bad government policies.
Overall, this suggests that to reduce the number or intensity of catastrophes, we should attack not just immediate causes, but also more systemic upstream causes.
Species Extinctions
As a second reference class, I considered extinctions of non-human species.[6] This is more difficult to analyze, for several reasons:
Most extinctions occurred many millions of years ago, so we have only indirect evidence, and there is significant sampling bias since some species are more easily preserved as fossils.
A species can go extinct if it gradually adapts into a new species, which we might not want to count as a “catastrophe”.
Some purported mass extinction events may actually be many smaller events occurring over a period of time.
To reduce these difficulties, I will focus on two relatively recent extinction events:
The Late Quaternary Extinctions (Koch and Barnosky, 2006), which occurred 10,000-50,000 years ago and led to most large mammals becoming extinct.
The Holocene Extinctions, occurring over the past 10,000 years (and increasing over the past century), primarily driven by human hunting and habitat destruction.
While most historical mass extinction events were driven by climate change or natural disasters, these two more recent extinctions are argued to have been driven in whole or part by humans. I’ll review the evidence and leading theories about both extinction events below.
Historical Base Rate
Before discussing the Quaternary and Holocene extinctions, let’s compute a base rate for context. Based on the fossil record, there is approximately one extinction per species per million years on average.[7] However, these extinctions are not constant across time but instead come in “pulses”, as shown below (image from Wikipedia):
During these pulses, extinctions per million years are roughly 2-10x the background rate.[8]
Late Quaternary Extinction
The Late Quaternary Extinction spanned a period from around 50,000 to 10,000 years ago. Over this time, around 34% of all mammals went extinct, including most mammals in the Americas and Australia and nearly all large mammals worldwide. This is an order of magnitude higher than the expected background extinction rate (which would be ~4% over 40,000 years).
The tables below (adapted from Wikipedia) document extinctions by geographic region and by size:
As the tables show, extinctions were least severe in Africa (where humans originated, so mammals could co-evolve defenses), and were most severe in large mammals.
Causes. Historically, researchers debated whether these extinctions were driven by climate change or human contact. To understand this debate, I read several papers and chose to follow Koch & Barnosky (2006), which systematically reviews a number of competing theories. Koch & Barnosky conclude that the pattern and intensity of extinctions was driven by humans, but that climate change was an important additional contributor:
“Taken as a whole, recent studies suggest that humans precipitated the extinction in many parts of the globe through combined direct (hunting) and perhaps indirect (competition, habitat alteration and fragmentation) impacts, but that late Quaternary environmental change influenced the timing, geography, and perhaps magnitude of extinction. Put another way, absent the various impacts of Homo sapiens sapiens, it is highly unlikely global ecosystems would have experienced a mass extinction of large, slow-breeding animals in the late Quaternary. But, absent concurrent rapid climatic change evident in many parts of the globe, some species may have persisted longer.”
Thus there are several paths through which humans could have driven extinctions:
Direct hunting
Indirect hunting (by dogs, rats, and other animals that we brought with us)
Habitat destruction (e.g. by human-caused fire)
Importantly, different species likely went extinct for different reasons. Koch & Barnosky believe that most extinctions in Eurasia were due to climate change, that those in Australia and on most islands were due almost entirely to humans, and North America was primarily humans with climate as an exacerbating factor.
Here is one story that illustrates the key points. It is consistent with Koch & Barnosky, but elides uncertainty in favor of simplicity.
When humans arrived on islands, they brought along pigs, dogs, and rats, all of which preyed on indigenous species. Since island species were evolutionarily naive to these predators, many of them went extinct.
Habitat destruction due to fire and land clearing also contributed to island extinctions.
On larger land masses, mammals were not evolutionarily naive to carnivorous predators and so did not go extinct so easily. However, humans were very efficient hunters, enough to drive birth rates below death rates in many species, which eventually led to extinction over several millennia.
Importantly, humans have a diverse diet, so even as they hunted some mammals to extinction, they gathered enough food from other animals and plants to sustain a large population size, thus avoiding traditional predator-prey cycles.
In Africa and Eurasia, mammals co-evolved with humans or their predecessors over hundreds of thousands of years or more. They therefore had ample evolutionary time to develop defenses to efficient human hunters, explaining the lower rate of extinctions compared to America and Australia.
Overall, hunting by humans was probably the main driver of non-island extinctions, with other factors like climate change contributing. Importantly, it was not enough that humans were a novel predator, as novel predators do not always lead to extinction. It was also important that we were a particularly efficient predator that could occupy many geographic regions and had a diverse diet.
Holocene Extinction
The Holocene Extinction started around 10,000 years ago and has potentially accelerated recently, with most researchers believing that humans play an important role.
Paradoxically, despite occurring more recently, the extent of the Holocene Extinction is more disputed than the Late Quaternary Extinction, for two reasons. First, most other extinction counts rely on the fossil record, but Holocene extinctions are based on present and historical observations by humans; this makes direct comparison hard, as the two methods have different (and large) sampling biases. Second, the extent of Holocene extinctions is politicized because it is central to present-day arguments about natural preservation, so it is harder to find neutral sources.
After looking through several papers, I decided to follow Barnosky et al. (2011)[9], which carefully discusses several sources of sampling bias and attempts to correct for them. Barnosky et al. conclude that a few percent of total species have gone extinct in the past 500 years, which is an order of magnitude higher than the expected background rate of extinctions (note some papers give even higher estimates[10]). Barnosky et al. also conclude that if most endangered species go extinct in the next century and this rate continues, we would lose the majority of all species within several centuries, on par with only 5 historical (and generally slower) mass extinction events.
Causes. Barnosky et al. list several stressors that contribute to these extinctions: “rapidly changing atmospheric conditions and warming[...], habitat fragmentation, pollution, overfishing and overhunting, invasive species and pathogens[...], and expanding human biomass”. Koch and Barnosky (2006) add ecological disruptions from the Quaternary Extinctions as a further stressor.[11]
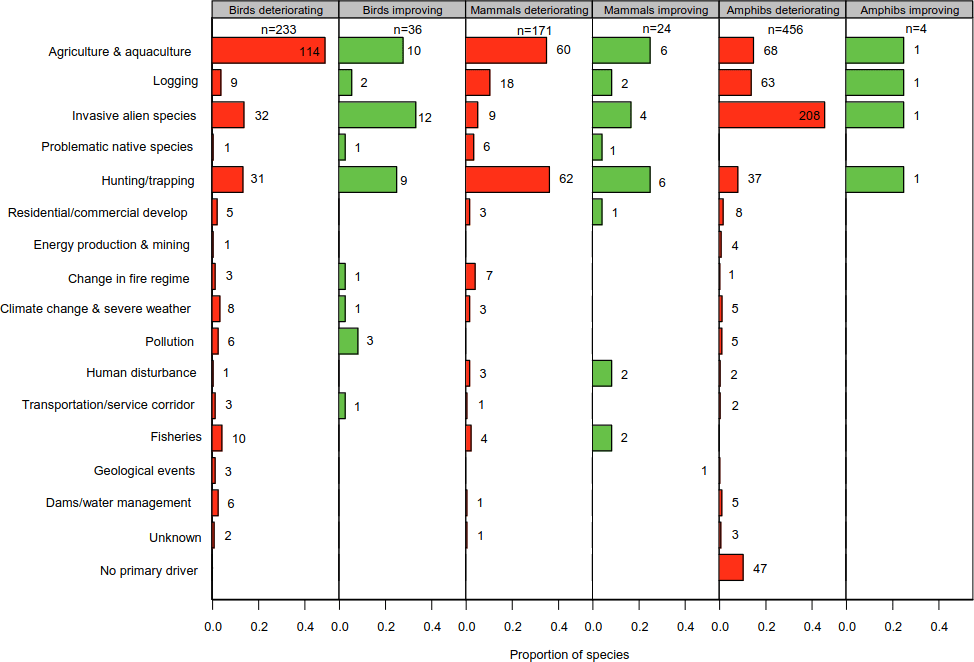
Unlike past extinctions, we can directly observe the causes of many of the Holocene extinctions as they occur in the present day. Based on Hoffmann et al. (2010), habitat destruction is the largest driver of current extinctions, followed by invasive species (including disease) and overhunting, followed by environmental causes such as climate change and pollution.[12][13]
Summary: What Are Typical Causes of Extinction?
Overall, my analysis of past extinctions point to several ways that a species can go extinct:
A large-scale disaster or climate event, which either directly makes a species unviable or else disrupts ecosystems and leads to later extinctions.
The introduction of a novel, aggressive organism for which the original species has not been adapted. This includes:
An invasive species, which can directly outcompete a species for its niche or disrupt the surrounding ecosystem.
A new, efficient predator. This most affects island species, as continental species have been evolutionarily exposed to a diverse enough set of predators to develop robust counter-strategies. However, very efficient predators with diverse diets can overwhelm these evolved defenses even for non-island species.
Changes in habitat (often from climate change or other species).
Follow-on effects from other species going extinct. This partially overlaps with items above: for instance, the extinction of megaherbivores led to the regrowth of forests, thus significantly changing the habitat of other species.
Thus, in general most species extinctions are caused by:
A second species which the original species has not had a chance to adapt to. This second species must also not be reliant on the original species to propagate itself.
A catastrophic natural disaster or climate event.
Habitat destruction or ecosystem disruption caused by one of the two sources above.
Why extinctions are usually rare. Since extinctions typically have a low base rate, causes of extinction must be rare. To better understand what can cause extinction, let’s understand why most threats to a species do not lead to extinctions.
First, most predators do not cause extinctions. This is because prey evolve defenses in tandem with predators’ offense, and the better a predator is the more evolutionary pressure on the prey (and so the faster defenses evolve). In addition to this, if prey become too rare then predator populations usually collapse, allowing the prey population to re-grow. Therefore, predators usually only cause extinctions if both (1) they enter a new environment with non-evolutionarily-adapted prey, and (2) they feed on multiple species, such that they can drive one species to extinction without their own population collapsing.
Similarly, novel pathogens do not by default lead to extinction of their hosts, since if they kill too many of the host species they don’t have targets to propagate to. Instead, “pathogens are more likely to cause host extinctions if they…[have] long-lived infectious stages, or are multi-host pathogens that can be transmitted between common reservoir hosts and more vulnerable target species” (Kilpatrick and Altizer, 2010).
Humans. Finally, let’s analyze why humans in particular were such efficient hunters that we were able to drive so many species to extinction. First, we are highly adaptable, thus being able to not just survive but live off multiple food sources in a variety of environments. This let us propagate globally and drive some species to extinction while still having alternate food sources. Second, we can coordinate effectively (Marean, 2015), overwhelming larger prey through better tactics. Finally, we used tools and technology to both increase our hunting ability and shape our environment, magnifying two of the key drivers of extinction discussed above.
Takeaways for Modern Catastrophes and for AI
Taking together all of the drivers for both human catastrophes and non-human extinctions, we see a small number of themes:
Very large-scale natural events
Highly adapted, self-replicating organisms, especially ones that the victim is not co-adapted to (epidemics, novel pathogens and predators, invasive species).
Coordinated groups of humans (wars, hunting, habitat destruction)
Political repression or disruption (forced labor, bad policies leading to famines)
Follow-on effects from other catastrophes.
Interestingly, technology does not seem to be a direct culprit in most human catastrophes, though it could be in the event of a large-scale nuclear war. For non-human extinctions, it is likely a contributor, since technology improves hunting ability and the ease of habitat destruction.
Looking at modern threats, nanotechnology and biotechnology both threaten to create novel self-replicators, and the inclusion of human design could lead them to be “adapted” in ways that are out-of-distribution relative to our evolutionary defenses.
Nuclear weapons increase the worst-case outcome of wars, and mass surveillance increases the worst-case outcome of political repression.
Climate change is a large-scale natural event. Aside from the direct effects, if it leads to many extinctions of non-human species, or induces political unrest, the follow-on effects could potentially be catastrophic for humans. The loss in biodiversity due to ongoing extinctions could also create bad follow-on effects, though it is happening slowly enough that it is probably not an immediate threat.
Finally, where do we put AI in this equation? Unfortunately, it looks to have many of the properties that underlie other drivers of catastrophes:
AI is self-replicating in the sense that it can copy itself, and can train itself to adapt to new data quickly. It is therefore an adapted self-replicator that humans are not themselves adapted to.
AI can likely be trained to coordinate better than humans, as humans evolutionarily were only adapted to coordinate in groups of ~150, whereas AI could be trained to coordinate in arbitrarily large groups if we solve the associated multi-agent RL challenges.
Economic displacement from AI could lead to political unrest.
AI is also a contributor to many of the other drivers above (though this is arguably double-counting): it makes mass surveillance easier and might speed the creation of other dangerous technologies such as engineered pathogens.
AI has ameliorating properties, as well. First, other new technologies have not caused catastrophes, which should decrease our prior on AI. Second, AI-assisted research could help with famines and climate change, and AI could decrease political unrest if it increases prosperity. These are important considerations, but many technologies share these properties, while almost none are adapted self-replicators that can coordinate in groups.
Overall, then, I expect AI to increase the rate of catastrophes. As calculated above, the base rate of very large (10% death rate) catastrophes over the next 25 years is 5%, and I personally expect AI to add an additional 10% on top of that, as I’ll justify in the next post.
Open questions. There are several questions not resolved by this post. First, my analysis was inconclusive on whether or how much the rate of catastrophes changes over time. Data from extinctions suggests that it can vary by an order of magnitude, but it would be better to have data about human events.
Second, this post says little about the importance of technology and intelligence, even though these are intuitively important. Are technological catastrophes increasing over time, even if right now they are too small to register in the data above? Do more intelligent species often drive less intelligent species to extinction?[15] Base rates on either of these would inform forecasts for AI.
Finally, one might argue that elapsed time is not the right x-axis, but instead elapsed population growth, economic growth, or technological progress. As one example, take world GDP. There have been as many doublings of world GDP since 1900 as there have been between 1900 and 0CE, so if GDP doublings are the right “clock” to measure against then we might expect many more catastrophes to happen each decade now than in the past. This doesn’t seem true to me from the data so far, but I’d like to see it analyzed in more detail.
Acknowledgments. Thanks especially to Dhruv Madeka for the discussions and initial data that inspired this post. Thanks also to Sham Kakade, Dean Foster, Tamay Berisoglu, Eli Lifland, Nuño Sempere, Daniel Kokotajlo, and Ege Erdil for useful discussions and comments on this post. Thanks to Justis Mills and Louise Verkin for copy-editing and helpful feedback.
Of course, numbers themselves can be misleading, as many historical numbers are based on guesswork! A lot of the work that went into this post was doing extensive reading to decide which numbers to believe. ↩︎
The Taiping rebellion is double-counted, once as a War and once as a Famine. ↩︎
As above, “fast” means taking less than one decade. ↩︎
Another theory is that the Mongol invasions (another catastrophe) spread the Black Death, since Mongols threw diseased corpses into cities as a form of biological warfare. This is not currently the predominant theory, but would be another instance of multi-causality, and shows that different major catastrophes can be linked to each other. ↩︎
Technically speaking, the historical fossil record usually only resolves extinctions at the level of genera rather than species, but I will generally elide this distinction for simplicity. ↩︎
Note that this varies by taxon and estimates within a taxon are approximate, with different estimates in the literature varying by a factor of 4 or sometimes greater. ↩︎
The 2-10x number is when looking at bins of 1 million years. For sudden catastrophic events such as an asteroid strike, the extinction rate over a 1-year time interval would spike much more than that. ↩︎
This is the same Barnosky as above, though I did not know that when searching for papers—in both cases he happened to write the papers that I found most neutral and persuasive. To my delight, I learned that he is also at UC Berkeley. Go bears! ↩︎
See e.g. Ceballos et al. (2015), with an estimate closer to two orders of magnitude above the background rate. ↩︎
“Examples include plants that have lost their primary agents of seed dispersal or that are replete with defenses for herbivores that no longer exist, herbivores that are “overdesigned” for all existing predators,
and scavengers such as condors that have no naturally occurring carcasses to eat in continental settings.” ↩︎
I follow Figure S7 of Hoffmann et al. (reproduced in the Appendix), which counts endangered species grouped by cause of endangerment. I grouped the rows into the categories “habitat destruction”, “invasive species” (which includes the chytrid fungus disease in amphibians), “overhunting/overfishing”, and “environment” (climate change / pollution / natural disasters). Some categories were ambiguous or did not fit into these 4. Overall I counted approximately ~360 in habitat destruction, ~250 from invasive species (dominated by amphibians), ~130 from overhunting/overfishing, and ~40 from environment. ↩︎
See also Dirzo & Raven (2003) who similarly claim that habitat destruction is the primary driver. ↩︎
A reservoir species is a second species in which the pathogen is not deadly, allowing it to multiply more freely, and from which the pathogen can cross over to the target species. ↩︎
The closest I found was Dembitzer et al. (2022), who claim that more intelligent mammals were less likely to go extinct during the Late Quaternary Extinction. However, we ideally want to study the opposite: are more intelligent mammals more likely to cause other species to go extinct? ↩︎
Appendix
Log-Log Plot of Catastrophes
As noted in Section 1, the distribution of catastrophes no longer follows Zipf’s law when we go below death tolls of 1%, as shown below:
One possibility is that the actual trend is log-normal instead of power law. Another is that less severe events are underreported.
To communicate risks, we often turn to stories. Nuclear weapons conjure stories of mutually assured destruction, briefcases with red buttons, and nuclear winter. Climate change conjures stories of extreme weather, cities overtaken by rising sea levels, and crop failures. Pandemics require little imagination after COVID, but were previously the subject of movies like Contagion.
Stories are great for conveying concrete risks (I myself recently did this for AI risks), but they’re a bad way to predict the future. That’s because most stories are far too specific to be probable. More importantly, stories tend to feature short, simple chains of causation while reality is complex and multi-causal.
Instead of using stories, most competitive forecasters start their forecasts by looking at historical reference classes. This works really well, and also makes sense: history pulls us away from the biases of story-telling by grounding in events that actually occurred. While history is filtered through narratives, a good history will contend with the complexity of reality, and we can further strip away narrative by grounding in raw numbers.[1]
In this post, I’ll use reference classes to understand the largest risks society faces today. I’ll do this by considering two different reference classes for historical catastrophes:
Looking at these reference classes teaches us two things. First, it gives us a numerical estimate of how rare different catastrophes are. If we define a catastrophe as an event killing 1% of the global population within a decade, then 11 such catastrophes have occurred since 1500, for a base rate of 2% per year. If we raise the bar to killing 10% of the population, the base rate drops by an order of magnitude, to 0.2%.
History also gives us qualitative insights. For instance, all the catastrophes in the previous paragraph were epidemics, wars, or famines. Further, many events were multi-causal—the worst epidemics occurred when populations were already weakened by famine, and many epidemics and famines were precipitated by changes in climate or by political turmoil. Species extinctions are also multi-causal, and the common culprits are climate change, natural disasters, invasive species, and humans.
One argument against using historical base rates is that the present is so different from the past (e.g. due to technology) that base rates are meaningless. While today’s world is indeed different from the past, base rates can help sharpen rather than neglect these differences, by clarifying what’s actually new. For instance, the mere presence of technology cannot move us far above the base rate, because many technologies have been developed throughout history and none has caused a catastrophe in the sense defined above. Instead, we should look for technology that shares properties with the historical drivers of catastrophe: epidemics, famines, wars, political turmoil, climate changes, natural disasters, invasive species, and humans.
I analyze these drivers in detail (Section 3), and find that they fall into a few core groups:
This list makes sense—to have a global impact, something should either start out with a global scale (large natural events), or have a means to get there (self-replication, coordination).
From this perspective, what are the possible drivers of catastrophe in the 21st century? Some answers are obvious from the list above—pandemics, climate change, and major wars continue to be serious threats. Famines are less obviously threatening, as the last major one was in 1961, but preparing for them may still be prudent. And political turmoil, when not itself catastrophic, creates the conditions for other catastrophes to occur.
Turning to new technologies, engineered pathogens are dangerous because they are novel self-replicators, as are certain types of nanotech. Nuclear weapons are dangerous because they have similar effects to natural disasters, and because they increase the worst-case damage from war.
Finally, AI (my own area of study) unfortunately has properties in common with many drivers of catastrophe. It is a novel self-replicator (it can copy itself) that can quickly adapt to new data. AI systems can be trained to coordinate and may seek power, mirroring the threat of coordinated groups of humans. Finally, AI may exacerbate other drivers of catastrophe if it leads to economic unrest and subsequent political turmoil.
Historical Causes of Human Population Loss
To start our analysis, I looked at the largest historical causes of human population loss, as measured by the fraction of the global population that was killed by a given event. To do so, I combined data from the Wikipedia lists of major wars, slavery and other forced labor, famines, epidemics, and natural disasters. I considered other data sources such as technological disasters, but all of these had much smaller death tolls than the five above. The main exception is genocides, as these often co-occurred with wars and are already included in those death tolls, so I excluded them to avoid double-counting.
I wrote a Python script (shared in the Appendix) to scrape these sources and aggregate them into a single Pandas dataframe, then filtered to create two datasets:
The set of catastrophes comprises 85 events, of which 80 occurred since 0 CE, and of which 33 were wars, 28 were famines, 15 were epidemics, 6 were forced labor, and 3 were natural disasters. The strict catastrophes comprise 17 events: 5 wars, 8 famines, and 4 epidemics. I include the complete list of strict catastrophes below, as well as a scatter plot of all catastrophes (see the Appendix for raw data).
In addition to these historical events, two important prehistoric events are the Toba catastrophe (97% drop in human population, possibly due to a supervolcano) and the 4.2kya event (likely led to global famines, but death toll is unclear).
Reporting bias and base rates. There is very likely reporting bias, as we see the rate of catastrophes “increase” in the 1500s and again in the 1900s, and this happens for all categories including famines (which should decrease over time with better technology). If we start from 1500, there have been 51 catastrophes (0.11/year), and 11 strict catastrophes (0.02/year).
Let’s next model how the base rate of (fast) catastrophes[4] varies with their severity. Looking at all catastrophes that lead to at least a 1% population drop, we see an approximately Zipfian distribution: the probability of a catastrophe with a death rate of r is proportional to 1/r.
Based on this, catastrophes with 10% death rates have an incidence of 0.002/year (once per 5 centuries) and those with a 1% death rate occur 0.02/year (twice per century). While these numbers might seem low, they imply that there is about a 5% chance of a 10%-death-rate catastrophe in the next 25 years (since 0.002 * 25 = 0.05).
Below 1% death rates, catastrophes are less likely than Zipf’s law predicts (see Appendix). For instance, the empirical frequency for 0.1% death rates is 0.08/year (slightly less than once per decade).
Trends over time. If we count the catastrophes in each decade since 1500, we obtain the following plot:
There were many more catastrophes in the period 1850-1950, although I suspect this is an artifact of reporting bias. Prior to this period, the rate of catastrophes appears roughly constant over time: neither a Ljung-Box test nor a Wald-Wolfowitz test is able to reject the null that catastrophes were identically distributed across decades from 1500-1900 (p=0.36 and 0.26, respectively).
The most notable change over time is the calm period that we are currently in, starting around 1950-1960. Indeed, catastrophes decreased significantly since the first half of the 20th century:
Famines plausibly decreased due to better food production and storage, which is hopefully a lasting improvement. Wars probably decreased due to the Pax Americana, but that unfortunately may now be unwinding with growing global tensions. Thus epidemics and (possibly) wars are the main modern sources of catastrophe so far.
Qualitative analysis: multi-causality. Many catastrophes have multiple causes. For instance, in the predominant theory of the Black Death, climate change was a driver in two ways. First, climate change in Asia led rodents to migrate from mountainous areas to more populated regions, spreading the disease. Second, the Little Ice Age in Europe led to famines, causing populations to be weak and thus more susceptible to disease.[5] Interestingly, the Black Death may have also intensified the Little Ice Age by causing reforestation where populations decreased, leading to carbon capture and subsequent cooling.
To give several other examples of multiple causes:
Overall, this suggests that to reduce the number or intensity of catastrophes, we should attack not just immediate causes, but also more systemic upstream causes.
Species Extinctions
As a second reference class, I considered extinctions of non-human species.[6] This is more difficult to analyze, for several reasons:
To reduce these difficulties, I will focus on two relatively recent extinction events:
While most historical mass extinction events were driven by climate change or natural disasters, these two more recent extinctions are argued to have been driven in whole or part by humans. I’ll review the evidence and leading theories about both extinction events below.
Historical Base Rate
Before discussing the Quaternary and Holocene extinctions, let’s compute a base rate for context. Based on the fossil record, there is approximately one extinction per species per million years on average.[7] However, these extinctions are not constant across time but instead come in “pulses”, as shown below (image from Wikipedia):
During these pulses, extinctions per million years are roughly 2-10x the background rate.[8]
Late Quaternary Extinction
The Late Quaternary Extinction spanned a period from around 50,000 to 10,000 years ago. Over this time, around 34% of all mammals went extinct, including most mammals in the Americas and Australia and nearly all large mammals worldwide. This is an order of magnitude higher than the expected background extinction rate (which would be ~4% over 40,000 years).
The tables below (adapted from Wikipedia) document extinctions by geographic region and by size:
As the tables show, extinctions were least severe in Africa (where humans originated, so mammals could co-evolve defenses), and were most severe in large mammals.
Causes. Historically, researchers debated whether these extinctions were driven by climate change or human contact. To understand this debate, I read several papers and chose to follow Koch & Barnosky (2006), which systematically reviews a number of competing theories. Koch & Barnosky conclude that the pattern and intensity of extinctions was driven by humans, but that climate change was an important additional contributor:
“Taken as a whole, recent studies suggest that humans precipitated the extinction in many parts of the globe through combined direct (hunting) and perhaps indirect (competition, habitat alteration and fragmentation) impacts, but that late Quaternary environmental change influenced the timing, geography, and perhaps magnitude of extinction. Put another way, absent the various impacts of Homo sapiens sapiens, it is highly unlikely global ecosystems would have experienced a mass extinction of large, slow-breeding animals in the late Quaternary. But, absent concurrent rapid climatic change evident in many parts of the globe, some species may have persisted longer.”
Thus there are several paths through which humans could have driven extinctions:
Importantly, different species likely went extinct for different reasons. Koch & Barnosky believe that most extinctions in Eurasia were due to climate change, that those in Australia and on most islands were due almost entirely to humans, and North America was primarily humans with climate as an exacerbating factor.
Here is one story that illustrates the key points. It is consistent with Koch & Barnosky, but elides uncertainty in favor of simplicity.
Overall, hunting by humans was probably the main driver of non-island extinctions, with other factors like climate change contributing. Importantly, it was not enough that humans were a novel predator, as novel predators do not always lead to extinction. It was also important that we were a particularly efficient predator that could occupy many geographic regions and had a diverse diet.
Holocene Extinction
The Holocene Extinction started around 10,000 years ago and has potentially accelerated recently, with most researchers believing that humans play an important role.
Paradoxically, despite occurring more recently, the extent of the Holocene Extinction is more disputed than the Late Quaternary Extinction, for two reasons. First, most other extinction counts rely on the fossil record, but Holocene extinctions are based on present and historical observations by humans; this makes direct comparison hard, as the two methods have different (and large) sampling biases. Second, the extent of Holocene extinctions is politicized because it is central to present-day arguments about natural preservation, so it is harder to find neutral sources.
After looking through several papers, I decided to follow Barnosky et al. (2011)[9], which carefully discusses several sources of sampling bias and attempts to correct for them. Barnosky et al. conclude that a few percent of total species have gone extinct in the past 500 years, which is an order of magnitude higher than the expected background rate of extinctions (note some papers give even higher estimates[10]). Barnosky et al. also conclude that if most endangered species go extinct in the next century and this rate continues, we would lose the majority of all species within several centuries, on par with only 5 historical (and generally slower) mass extinction events.
Causes. Barnosky et al. list several stressors that contribute to these extinctions: “rapidly changing atmospheric conditions and warming[...], habitat fragmentation, pollution, overfishing and overhunting, invasive species and pathogens[...], and expanding human biomass”. Koch and Barnosky (2006) add ecological disruptions from the Quaternary Extinctions as a further stressor.[11]
Unlike past extinctions, we can directly observe the causes of many of the Holocene extinctions as they occur in the present day. Based on Hoffmann et al. (2010), habitat destruction is the largest driver of current extinctions, followed by invasive species (including disease) and overhunting, followed by environmental causes such as climate change and pollution.[12][13]
Summary: What Are Typical Causes of Extinction?
Overall, my analysis of past extinctions point to several ways that a species can go extinct:
Thus, in general most species extinctions are caused by:
Why extinctions are usually rare. Since extinctions typically have a low base rate, causes of extinction must be rare. To better understand what can cause extinction, let’s understand why most threats to a species do not lead to extinctions.
First, most predators do not cause extinctions. This is because prey evolve defenses in tandem with predators’ offense, and the better a predator is the more evolutionary pressure on the prey (and so the faster defenses evolve). In addition to this, if prey become too rare then predator populations usually collapse, allowing the prey population to re-grow. Therefore, predators usually only cause extinctions if both (1) they enter a new environment with non-evolutionarily-adapted prey, and (2) they feed on multiple species, such that they can drive one species to extinction without their own population collapsing.
Similarly, novel pathogens do not by default lead to extinction of their hosts, since if they kill too many of the host species they don’t have targets to propagate to. Instead, “pathogens are more likely to cause host extinctions if they…[have] long-lived infectious stages, or are multi-host pathogens that can be transmitted between common reservoir hosts and more vulnerable target species” (Kilpatrick and Altizer, 2010).
Humans. Finally, let’s analyze why humans in particular were such efficient hunters that we were able to drive so many species to extinction. First, we are highly adaptable, thus being able to not just survive but live off multiple food sources in a variety of environments. This let us propagate globally and drive some species to extinction while still having alternate food sources. Second, we can coordinate effectively (Marean, 2015), overwhelming larger prey through better tactics. Finally, we used tools and technology to both increase our hunting ability and shape our environment, magnifying two of the key drivers of extinction discussed above.
Takeaways for Modern Catastrophes and for AI
Taking together all of the drivers for both human catastrophes and non-human extinctions, we see a small number of themes:
Interestingly, technology does not seem to be a direct culprit in most human catastrophes, though it could be in the event of a large-scale nuclear war. For non-human extinctions, it is likely a contributor, since technology improves hunting ability and the ease of habitat destruction.
Looking at modern threats, nanotechnology and biotechnology both threaten to create novel self-replicators, and the inclusion of human design could lead them to be “adapted” in ways that are out-of-distribution relative to our evolutionary defenses.
Nuclear weapons increase the worst-case outcome of wars, and mass surveillance increases the worst-case outcome of political repression.
Climate change is a large-scale natural event. Aside from the direct effects, if it leads to many extinctions of non-human species, or induces political unrest, the follow-on effects could potentially be catastrophic for humans. The loss in biodiversity due to ongoing extinctions could also create bad follow-on effects, though it is happening slowly enough that it is probably not an immediate threat.
Finally, where do we put AI in this equation? Unfortunately, it looks to have many of the properties that underlie other drivers of catastrophes:
AI has ameliorating properties, as well. First, other new technologies have not caused catastrophes, which should decrease our prior on AI. Second, AI-assisted research could help with famines and climate change, and AI could decrease political unrest if it increases prosperity. These are important considerations, but many technologies share these properties, while almost none are adapted self-replicators that can coordinate in groups.
Overall, then, I expect AI to increase the rate of catastrophes. As calculated above, the base rate of very large (10% death rate) catastrophes over the next 25 years is 5%, and I personally expect AI to add an additional 10% on top of that, as I’ll justify in the next post.
Open questions. There are several questions not resolved by this post. First, my analysis was inconclusive on whether or how much the rate of catastrophes changes over time. Data from extinctions suggests that it can vary by an order of magnitude, but it would be better to have data about human events.
Second, this post says little about the importance of technology and intelligence, even though these are intuitively important. Are technological catastrophes increasing over time, even if right now they are too small to register in the data above? Do more intelligent species often drive less intelligent species to extinction?[15] Base rates on either of these would inform forecasts for AI.
Finally, one might argue that elapsed time is not the right x-axis, but instead elapsed population growth, economic growth, or technological progress. As one example, take world GDP. There have been as many doublings of world GDP since 1900 as there have been between 1900 and 0CE, so if GDP doublings are the right “clock” to measure against then we might expect many more catastrophes to happen each decade now than in the past. This doesn’t seem true to me from the data so far, but I’d like to see it analyzed in more detail.
Acknowledgments. Thanks especially to Dhruv Madeka for the discussions and initial data that inspired this post. Thanks also to Sham Kakade, Dean Foster, Tamay Berisoglu, Eli Lifland, Nuño Sempere, Daniel Kokotajlo, and Ege Erdil for useful discussions and comments on this post. Thanks to Justis Mills and Louise Verkin for copy-editing and helpful feedback.
Of course, numbers themselves can be misleading, as many historical numbers are based on guesswork! A lot of the work that went into this post was doing extensive reading to decide which numbers to believe. ↩︎
Population sizes were collected from Our World in Data, see Appendix. ↩︎
The Taiping rebellion is double-counted, once as a War and once as a Famine. ↩︎
As above, “fast” means taking less than one decade. ↩︎
Another theory is that the Mongol invasions (another catastrophe) spread the Black Death, since Mongols threw diseased corpses into cities as a form of biological warfare. This is not currently the predominant theory, but would be another instance of multi-causality, and shows that different major catastrophes can be linked to each other. ↩︎
Technically speaking, the historical fossil record usually only resolves extinctions at the level of genera rather than species, but I will generally elide this distinction for simplicity. ↩︎
Note that this varies by taxon and estimates within a taxon are approximate, with different estimates in the literature varying by a factor of 4 or sometimes greater. ↩︎
The 2-10x number is when looking at bins of 1 million years. For sudden catastrophic events such as an asteroid strike, the extinction rate over a 1-year time interval would spike much more than that. ↩︎
This is the same Barnosky as above, though I did not know that when searching for papers—in both cases he happened to write the papers that I found most neutral and persuasive. To my delight, I learned that he is also at UC Berkeley. Go bears! ↩︎
See e.g. Ceballos et al. (2015), with an estimate closer to two orders of magnitude above the background rate. ↩︎
“Examples include plants that have lost their primary agents of seed dispersal or that are replete with defenses for herbivores that no longer exist, herbivores that are “overdesigned” for all existing predators,
and scavengers such as condors that have no naturally occurring carcasses to eat in continental settings.” ↩︎
I follow Figure S7 of Hoffmann et al. (reproduced in the Appendix), which counts endangered species grouped by cause of endangerment. I grouped the rows into the categories “habitat destruction”, “invasive species” (which includes the chytrid fungus disease in amphibians), “overhunting/overfishing”, and “environment” (climate change / pollution / natural disasters). Some categories were ambiguous or did not fit into these 4. Overall I counted approximately ~360 in habitat destruction, ~250 from invasive species (dominated by amphibians), ~130 from overhunting/overfishing, and ~40 from environment. ↩︎
See also Dirzo & Raven (2003) who similarly claim that habitat destruction is the primary driver. ↩︎
A reservoir species is a second species in which the pathogen is not deadly, allowing it to multiply more freely, and from which the pathogen can cross over to the target species. ↩︎
The closest I found was Dembitzer et al. (2022), who claim that more intelligent mammals were less likely to go extinct during the Late Quaternary Extinction. However, we ideally want to study the opposite: are more intelligent mammals more likely to cause other species to go extinct? ↩︎
Appendix
Log-Log Plot of Catastrophes
As noted in Section 1, the distribution of catastrophes no longer follows Zipf’s law when we go below death tolls of 1%, as shown below:
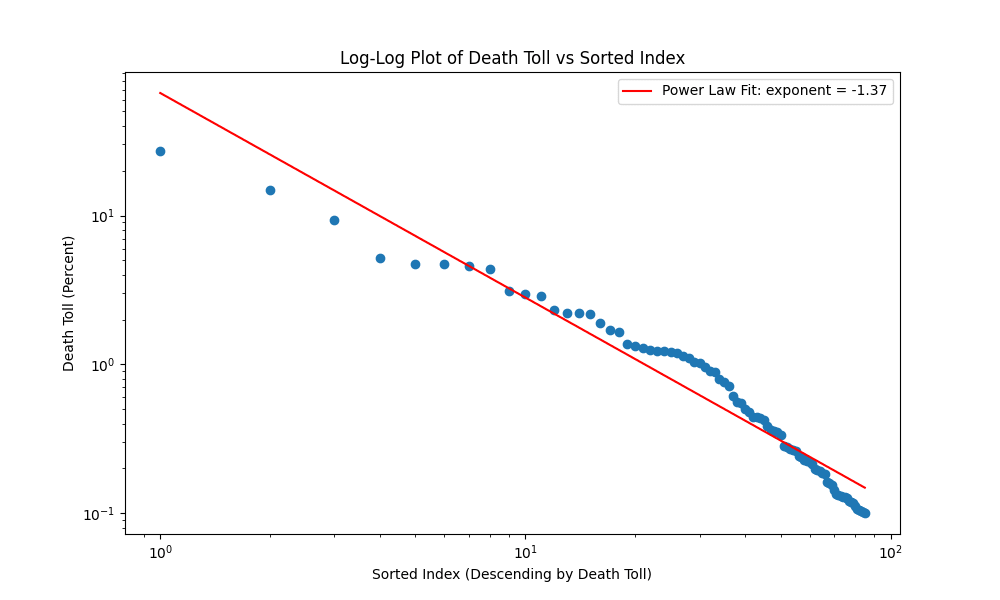
One possibility is that the actual trend is log-normal instead of power law. Another is that less severe events are underreported.
Species Endangerment by Cause
The following is a reproduction of Figure S7 from Hoffmann et al. (2010).
Population by Country Across History
Scraping Script
Complete List of All Major Catastrophes