Phase transitions and AGI
This essay was submitted to the AI Progress Essay Contest, an initiative that focused on the timing and impact of transformative artificial intelligence. You can read the results of the contest and the winning essays here.
Take a look at the following graph, from Robin Hanson's Long-Term Growth As a Sequence of Exponential Modes:
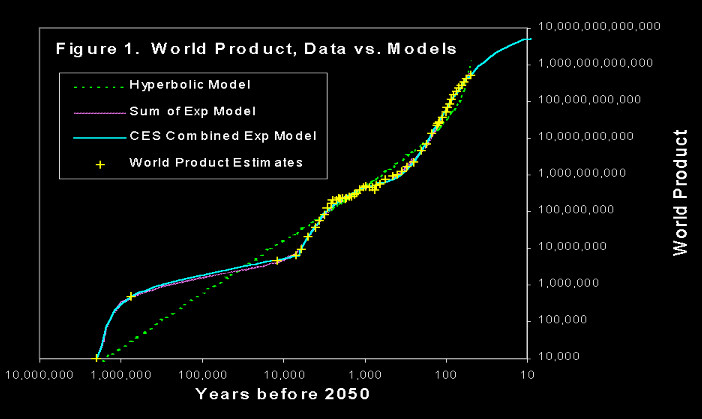
Here, "world product" is roughly the gross world product divided by the level of income necessary for one person to live at a subsistence level. It measures the total production of the human species in units of "how many people could live at a subsistence level on that much production?"
The yellow marks are historical estimates of world product that Hanson gathered from a variety of sources, and he's fit three different models to this data. What's notable is the good fit that the "sum of exponentials" type models have with this data. It looks like the world economy goes through different phases which are characterized by different rates of growth: in the first phase world product doubled every ∼100,000 years, in the second phase it doubled every ∼1000 years, and in the third phase it doubled every ∼10 years, where we can give or take a factor of 2 from these estimates - they are meant only to convey the order of magnitude differences.
We also see that transitions to subsequent phases are relatively fast. The transition from the first phase to the second phase took ∼1000 years, much less than the doubling time of 100,000 years characterizing this phase, and the transition from the second phase to the third took on the order of ∼200 years, still smaller than the 1000 years of doubling time typical of the second phase. We can also observe that the timing of these events roughly matches the First Agricultural Revolution and the Industrial Revolution, so we might tentatively label the phases as corresponding to "foraging", "farming" and "industry" respectively.
The study of these past transitions is important because they are the only reference class we have for dramatic changes in the nature of the world economy and in how the human species is organized and how we coordinate our activities. Since we have two transitions to examine, we might also get a rudimentary sense of the variance of outcomes: two is the minimal value we need in order to do that.
Unfortunately, many details about the foraging phase are shrouded in mystery. There's still no consensus on the world product estimates for this phase even today: it could be that this phase was actually ten times shorter than we think it is, and it might only date back to around 200,000 BCE rather than 2,000,000 BCE. In this case, the doubling time in this phase would be higher, about ∼10,000 years. This is still much slower than what came after, and still large compared to how long it took for the transition to take place.
Regardless, the first conclusion we should draw from this reference class is that such phase transitions are possible and they can happen surprisingly quickly compared to the pace of the changes that people who lived in a particular phase would be used to. We can draw a second conclusion by noting that while the durations of the phases vary quite a lot, the number of doublings of world product in each phase seems to be similar: ∼10, give or take a factor of 2. Given the small sample size and the difficulties of generalization, it's hard to extrapolate the duration of the industrial phase based on this information, but it does suggest that the phase coming to an end soon wouldn't be surprising from an outside point of view.
The question this essay is meant to answer is broadly this: how likely is a phase transition in the near future, and given that one occurs, how likely is it to be brought about by AGI? (By definition, I take transformative AI to be precisely a development in AI which triggers such a phase transition.)
Outside view
One important question we should ask is how far in advance it's possible to see phase transitions coming. The answer to this seems to be "less than half of a doubling time" given the past examples. In other words, since the world economy is currently doubling every 20 years or so, we probably shouldn't expect to see any sign of an impending phase transition until we're less than a decade away from it. Therefore, the fact that nothing special seems to be happening now shouldn't affect our assessment of the odds of a phase transition in the next century.
On the other hand, the outside view also should lead us to be cautious about what mode of organization will become dominant after the phase transition. It would have been quite difficult to anticipate in the year 1400 that the next phase would be associated with industry, since industry wasn't growing particularly fast relative to anything else in 1400.
Can we get a more precise idea about how long we can expect the industrial phase to last from an outside point of view? Here is one way to go about doing this: assume that D+1 where D is the number of doublings in a phase is drawn from a Pareto distribution with an unknown tail exponent α. Pareto distributions have heavy right tails and allow for a lot of uncertainty. This means the forecasts it implies will be quite conservative on transformative AI timelines, which might be a disadvantage for reasons I'll come back to shortly.
A Pareto distribution has one parameter: the exponent α. If we had a lot of data then we could estimate α using frequentist methods (such as maximum likelihood estimation) but since we don't, we have to use Bayesian methods to get anything useful out of this analysis.
The conjugate prior of the Pareto distribution is the same as the one of the exponential distribution, since the logarithm of a Pareto distributed random variable is exponentially distributed. This conjugate prior is given by the gamma distribution.
We start with the Jeffreys prior for the Pareto distribution, which is simply an improper prior proportional to 1/α. This formally corresponds to a gamma distribution Gamma(0,0) where the distribution is characterized in terms of its shape and rate respectively. Now, we do a Bayesian update: we have two observations of past phases and they took approximately 8.9 and 7.5 doublings - these values are taken from Hanson's paper - for the foraging and farming phases respectively. Using the conjugate prior updating rule for the exponential distribution after adding 1 and taking logarithms, we update to the posterior distribution:
\text{}(2, \log(9.9) + \log(8.5)) = \text{}(2, \log(84.15))
Now we can do a Monte Carlo simulation by first sampling values of α from the posterior and conditioning on there having been at least 10 doublings so far in the current phase, and then sampling some value of the number of doublings until the end of the current phase. This give us a sample from which we can infer what the percentiles of various outcomes must be.
The cumulative distribution function looks like this:
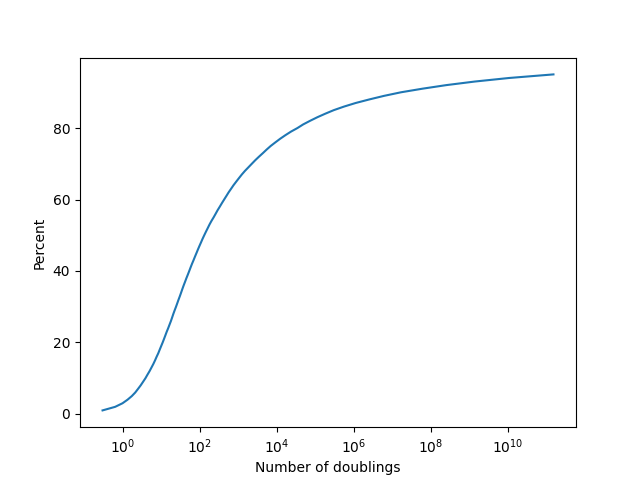
The reason the percentiles after the median get so large is because of the aforementioned property that the Pareto distribution has heavy tails. Since sustaining doublings indefinitely has a substantial chance of being outside the realm of physical possibilities, we might want to also try using a distribution which has thinner tails. A natural choice for this is the exponential distribution.
This calculation is remarkably similar since the exponential and Pareto distributions are closely related. Now we assume the number of doublings D is drawn directly from an exponential distribution with an unknown rate parameter λ. Once again the Jeffreys prior for λ is Gamma(0,0), and a similar Bayesian update gets us the posterior:
\text{}(2,7.5+8.9) = \text{}(2,16.4)
Repeating the Monte Carlo simulation from before in this new context gives the following cumulative distribution function:
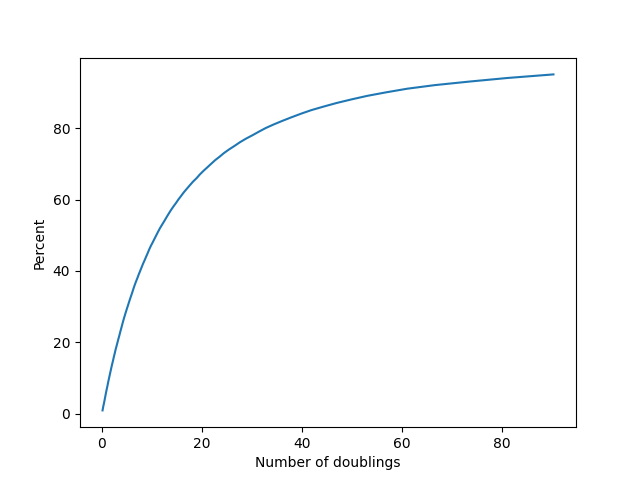
Which of these is a better choice? In my judgment the exponential distribution in this case is giving much more realistic timelines, and it's what I will be primarily relying on in order to make my forecasts. I include both models, however, as a way to show that our choice of model really affects our view of what the timeline should be like.
The main argument against using heavy tailed priors is that the number of doublings is already the base two logarithm of the factor by which world product increases by in a phase, so if we assume a heavy tailed distribution for it then we have to exponentiate that in order to get the actual growth in world product. This becomes similar to a double exponential which has a high probability of exceeding physical limits - how confident are we that, say, 9000 doublings of world product is even physically possible at all, let alone it all occurring in a single phase?
I also experimented with using a model in which D is sampled from a gamma distribution, but because its Jeffreys prior doesn't belong to its family of conjugate priors Bayesian inference on it gets quite hairy. In the end the results I get are somewhat more pessimistic than using an exponential, but the difference isn't pronounced.
Inside view
I think conditional on there being a phase transition in the next hundred years or so, it's likely (around 65%) that the cause of the transition will be the development of transformative AI. However, even if this is not true, reverse causality will then become operative: it's very hard to imagine that AGI is not achieved a short time after a phase transition. Even a factor 10 increase in the growth rate of the economy would be enough for AGI timelines to become quite compressed, for instance.
The reason I would give 65% odds to AGI being the driver of such a phase transition is that it's hard for me to tell a plausible story about any other technology that's currently on the horizon doing so. Moreover, one of the signs of a part of the economy that will be responsible for a phase transition is that it should have a fast growth rate and a plausible mechanism by which that fast growth rate can be sustained and take over the whole economy, and I think the only serious contender for this position right now is AI research. I wouldn't go higher than 65% because a technology that we can't yet see could end up being responsible for the phase transition: this is the same as the point I raised earlier about how industry wasn't growing fast relative to the rest of the economy in 1400.
My opinion is that the inside view right now favors a phase transition sometime between 2 and 5 doublings. It's difficult to imagine transformative AI coming along without at least one further doubling. Some relevant milestones here come from Holden Karnofsky's post on transformative AI forecasting using biological anchors:
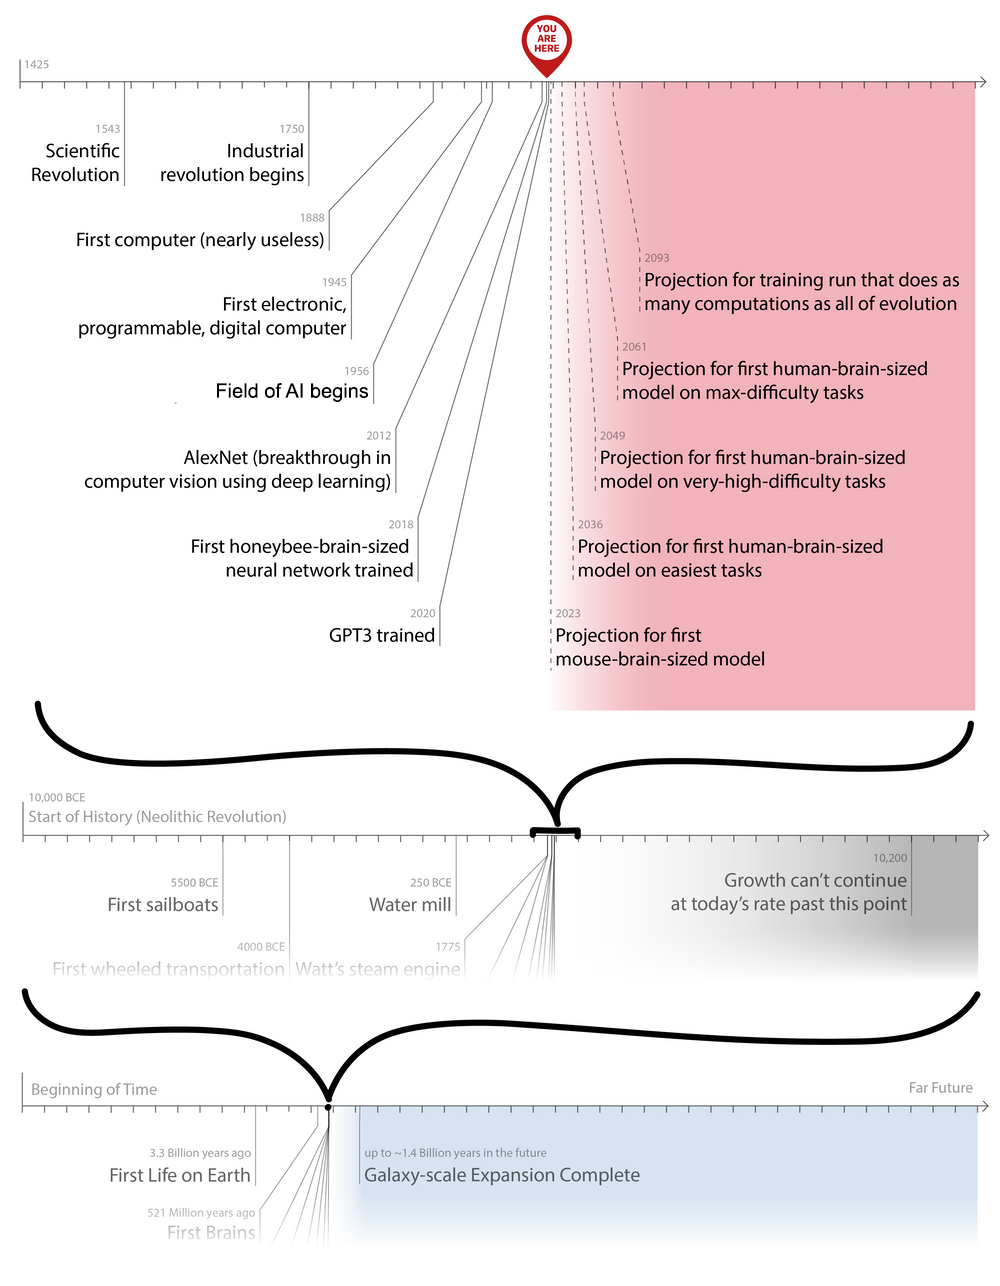
As Karnofsky says in his post:
Bio Anchors estimates a >10% chance of transformative AI by 2036, a 50% chance by 2055, and an 80% chance by 2100.
I think this is extremely optimistic. I agree with the timeline in likelihood terms: the maximum likelihood estimate on when we get transformative AI is probably "two to five doublings", which is roughly the same timeline here - again, their timeline seems a bit more optimistic, but broadly consistent. This roughly means that I think we would be most likely to be seeing the kind of world we are seeing now if we were around two to five doublings away from a phase transition.
However, a good Bayesian has to combine likelihoods with priors in order to get a posterior distribution, and this is my primary point of disagreement with the Bio Anchors timeline: the outside view, in other words the prior distribution, suggests a phase transition occuring soon is unlikely. The industrial phase is roughly 200 years old, and it has lasted for around 10 doublings already. Conditional on that, even if we just assume a constant rate of arrival for the end of the current phase (which will be rather optimistic), we should get a maximum likelihood estimate of around 10% every doubling for it to happen. The median forecast would then be around 7 doublings until the end of the current phase. If we want to go down from 7 to below 2, we need to have very strong evidence that a phase transition is going to happen, and I don't think AI developments so far provide any such evidence.
More explicitly, consider the second cumulative distribution funciton plot above. Two doublings is roughly the 14th percentile of outcomes, so ℙ(D≤2)≈0.14. The corresponding odds ratio is 0.14/0.86=0.162 or so. To update from this odds ratio to even odds requires a Bayes factor of roughly 1/0.162≈6. In other words, to justify a median forecast of two more doublings, the world would have to be 6 times more likely to look as it does under the hypothesis D≤2 than under the alternative D>2. In my judgment the available evidence comes nowhere close to meeting this stringent standard, and I'm curious to hear from people who think otherwise.
Most of the expectation of imminent transformative AI rests on extrapolations such as the one in the graph: if we train a big enough model (human brain-sized, or more accurately, of a similar inferential complexity to the human brain) for a long enough time (compute used by all of evolution), we'll not only get human or superhuman performance on difficult tasks, but this performance will directly translate into a transformation of the global economy. I think the model uncertainty here is so large that updating too strongly away from the prior on this kind of argument is a bad idea.
Forecasts
There are three related questions that I'll forecast on:
I think all three of these questions are unlikely to resolve if there is no phase transition: I think the first one has around 15% chance of not resolving > in the absence of one, while the second and third are 1% or less. Therefore, my forecasts on all three questions are based on taking my outside view estimates, adjusting them slightly upwards due to the arguments given in the inside view section, and then making further adjustments based on the specific question.
I think mean GWP growth exceeding 10% per year for a sufficiently long time is approximately equivalent to there being a phase transition - it's highly unlikely that any phase transition would have a doubling time factor over the current phase that's less than 3. However, 30% growth in a single year is a stronger demand, so I've adjusted the distribution downwards to account for that. You shouldn't take the exact distribution too seriously, since it's difficult to input exact distributions and I haven't taken the effort to do so, but I've made sure that everything is consistent.
Mean GWP growth exceeding 6% could happen without a phase transition, but it's rather unlikely. It would require major governments around the world enacting wide-reaching economic reforms, or an unprecedented economic boom across most of the underdeveloped world. I put the odds of this at around 15%, and my forecast is more or less a combination of this with my estimate of the arrival time of a phase transition.
Discussion
Most transformative AI timelines focus strongly on the inside view: how long until neural networks become as big as the human brain, how long until we reach certain compute thresholds, how long do researchers in the field think we have until transformative AI, et cetera. I think the inside view is useful, but in the process the outside view is either ignored or not weighted strongly enough to balance out inside considerations.
This essay is meant to be a corrective for that: using Bayesian methods it's actually possible to get information about the timeline of when we can expect another phase transition purely based on the past two examples of such transitions. The distributions we get this way do end up being somewhat sensitive to assumptions about priors, especially at the tails, but overall I think using any standard "uninformative" prior is superior to just saying there's no outside view on the problem and focusing only on the inside view.
Comments
Relevant work:
- David Roodman, "Modeling the Human Trajectory" (2020)
- Tom Davidson, "Semi-informative priors over AI timelines" (2021)
@t_adamczewski It's interesting to note that Davidson ends up with almost the same timeline that I end up with here and with a similar approach. His central estimate for AGI by 2100 is ~ 20% and mine is about the same, probably a little more to adjust for the inside view.
I didn't know about this report and it's good to know I'm not the only person who thought of using this idea. I would have mentioned it in the post had I known about it in advance.
— edited by ege_erdil
Note: you can replicate the Monte Carlo simulations I used to obtain the two cumulative distribution functions by running this script.
Matthew_Barnett
·I've copied my response below from Lesswrong
I agree that the transition from foraging to farming probably was a relatively clear phase shift in human civilization. But the transition from farming to industry seems more murky to me, with the data being compatible with continuous acceleration (ie. hyperbolic growth). (See also this thread on the EA forum).
For instance, my understanding is that European nations experienced substantial per-capita growth in the centuries leading up to the industrial revolution. And unlike farming, the industrial revolution had no single cause that we can point to that makes it a distinct technological "revolution", or phase shift. An alternative explanation is that what we call the industrial revolution is simply the latest part of the hyperbolic growth trend that humanity has experienced since roughly 10,000 BC.
Edit: Scott Alexander has a much longer discussion about this here.
One interesting fact about our era is that growth has recently slowed since 1960. But I think there's a relatively simple explanation of that fact, that sheds light on the long-run data. In particular, I am inclined towards Michael Kremer's explanation that the rate of technological progress is proportional to the total population, since a larger population supports more idea generation. Combined with the Malthusian assumption that the growth rate in the population is proportional to the rate of growth in technology, this model implies that economic growth will be hyperbolic, which is indeed what we saw until the demographic transition during the mid-20th century.
The significance of Michael Kremer's model is its parsimony: it requires fitting only a single curve to the long-run data, as opposed to multiple exponential modes. But it can also be empirically tested, as Kremer does, by comparing the rate of economic growth in geographically isolated societies, and checking whether societies with higher initial populations had higher rates of technological growth.
Compared to the exponential growth sequence model, Kremer's model provides a much stronger theoretical foundation for AI-accelerated growth. This is because if we assume that AI can substitute for labor, then the effect of declining population growth from the demographic transition can be negated by growth in AI, allowing us to proceed on our previous hyperbolic trajectory.
Relatedly, I agree that the outside view of historical economic growth provides a relatively weak reason to expect transformative growth in the relative near-term (say, the next 100 years), but I think we shouldn't rely too much on simple extrapolation in this case. The main reason why the long-run historical growth data is important is because it validates the model that population growth and technological progress work together, in a way that predicts a singularity. Since this model is the primary justification given for transformative growth under AI in economic models, the long-run data provides a relatively strong update towards the plausibility of transformative growth this century.
As you noted yourself, even if the exponential growth sequence model is correct, we have extremely sparse information about the time between each transition. Given such a weak prior, it would be no surprise that vast amounts of real world observations might be enough to overwhelm it, and cause us to be much more confident in nearer term AI. I think we have such information, and it should play a prominent role in our timelines.
— edited by Matthew_Barnett
ege_erdil
·Likewise, copied over from LessWrong: @Matthew_Barnett
Your first point is not correct according to the data I have. It's only the UK and the Netherlands that experienced substantial per capita growth before the end of the Napoleonic Wars, and their growth pattern is consistent with a smoother phase transition.
I don't think it's necessary for a new phase to be associated clearly with a new technology. I agree that such an association makes the break from the previous phase much clearer, but I already think the break between the last phase and the current phase is clear, so...
I really don't think hyperbolic growth fits the data well at all. I'm honestly mystified by how so many people seem to take it so seriously - how does hyperbolic growth explain two centuries of approximately constant GDP per capita growth trend in the US or in the UK? A stochastic model can just explain it as a coincidence, but then the likelihood ratio should lead you to update away from a hyperbolic model.
I think this is very unclear because of difficulties in measuring inflation accurately due to changes in the nature of goods produced that have taken place since 1960. I think it's possible (20%) that in fact growth didn't slow down at all.
The fact that the Industrial Revolution began in Europe and not China or India, and the fact that it was so difficult of a process for it to spread to those places once it was already here, is evidence against this view. I agree more people is good for growth for this reason and others (specialization & division of labor, for example) but it only explains a small fraction of the variance in outcomes here. Even in Europe the Industrial Revolution began in Britain and the Netherlands, not France or Spain as this population model would have led us to expect.
Even if this happened, my model of what would happen is not hyperbolic. I think it would more or less be another phase shift which would last for some number of doublings before we hit diminishing returns or something else happened. A hyperbolic trajectory just seems like wishful thinking to me.
I don't agree that long-run historical growth data actually validates this. My belief that population size matters for technological growth comes mostly from my own priors rather than any updates I've made on the basis of looking at what happened in the past.
Overall, I really want someone who is a proponent of the hyperbolic model to explain to me why this model is so popular, because to me it seems obviously wrong. I'd be happy to schedule a call with someone just for this purpose.