People seem to be continually surprised, over and over again, by the new capabilities of big machine learning models, such as PaLM, DALL-E, Chinchilla, SayCan, Socratic Models, Flamingo, and Gato (all in the last two months!). Luckily, there is a famous paper on how AI progress is governed by scaling laws, where models predictably get better as they get larger. Could we forecast AI progress ahead of time by seeing how each task gets better with model size, draw out the curve, and calculate which size model is needed to reach human performance?
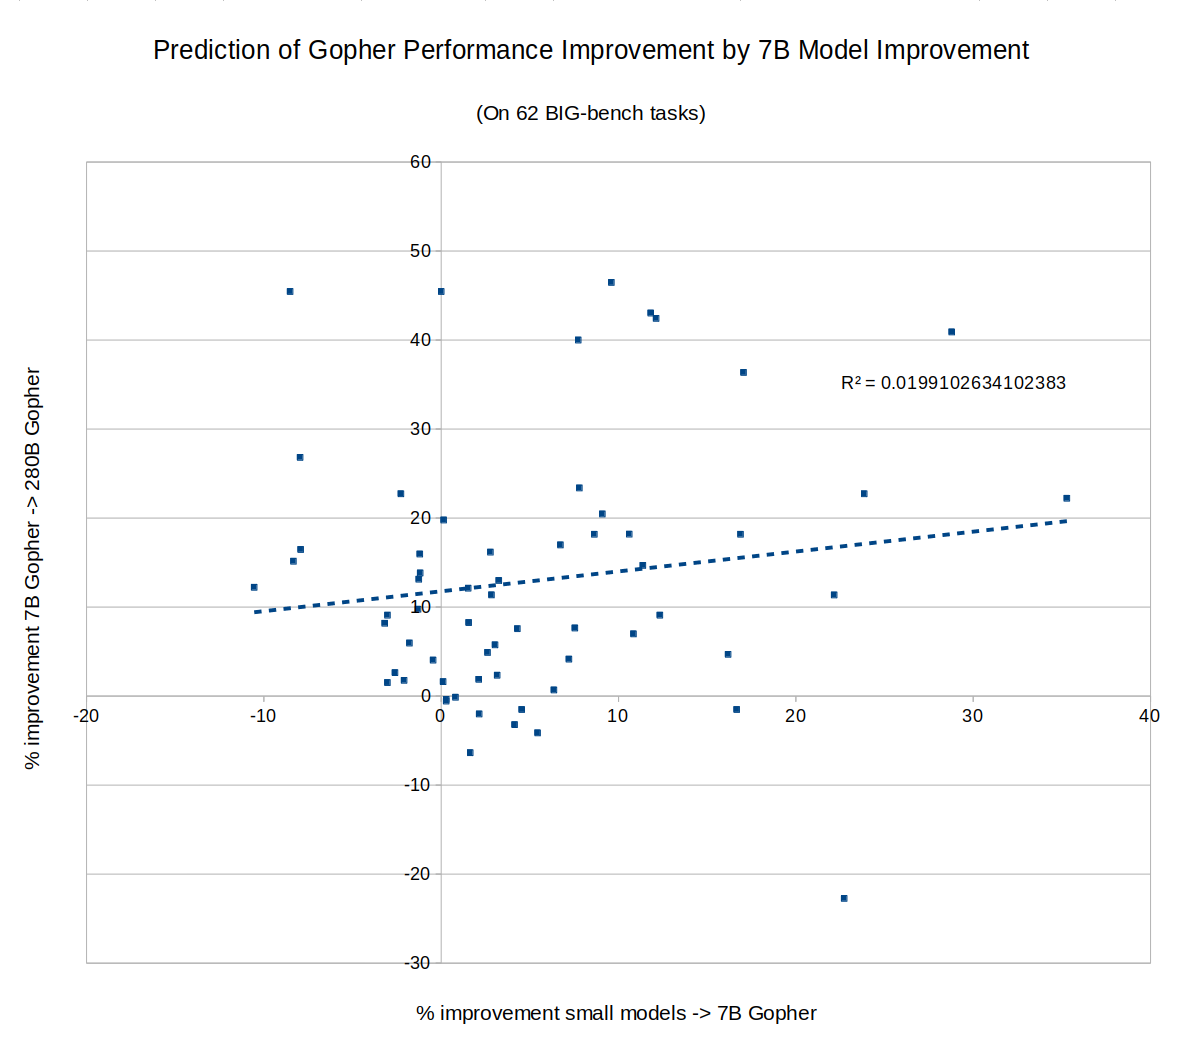
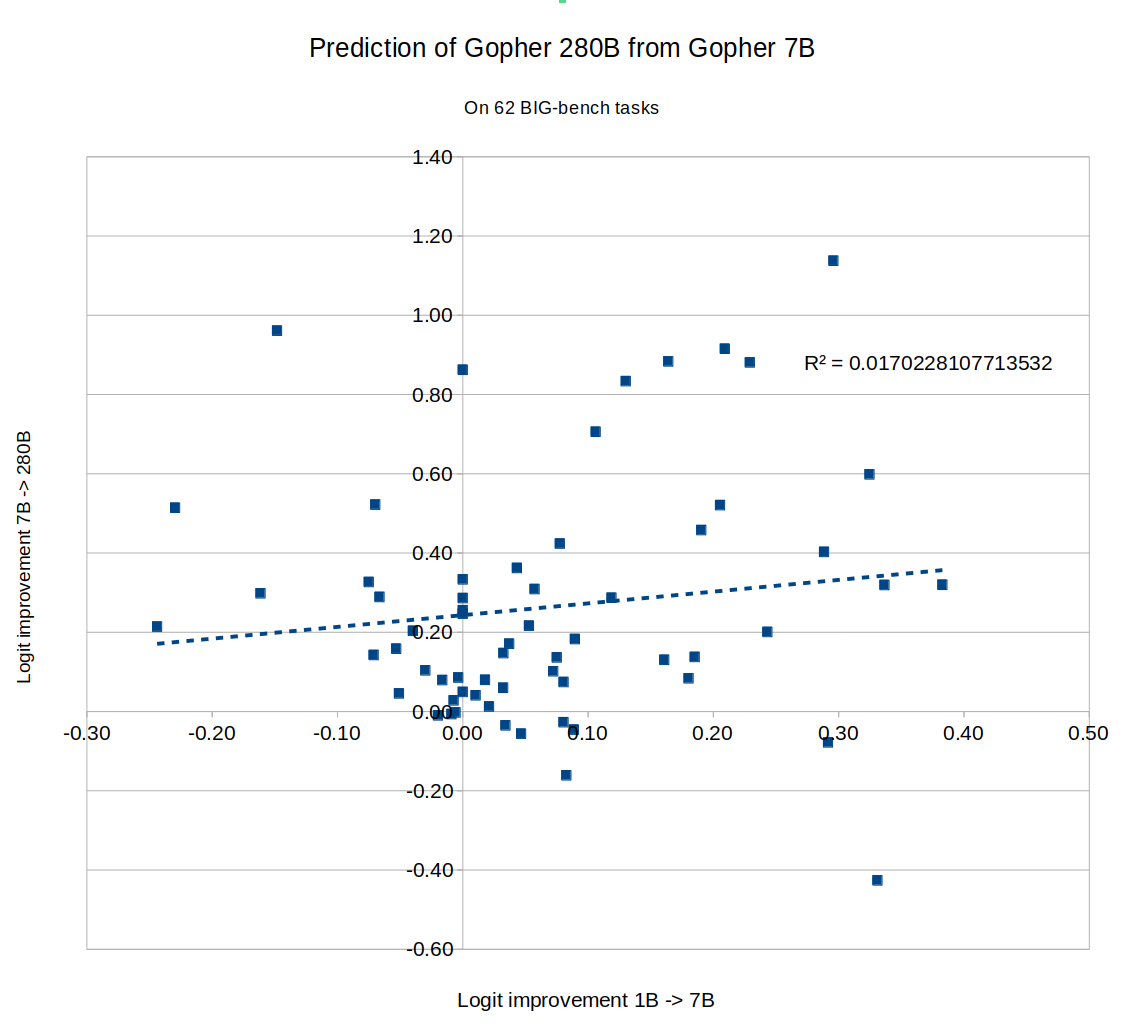
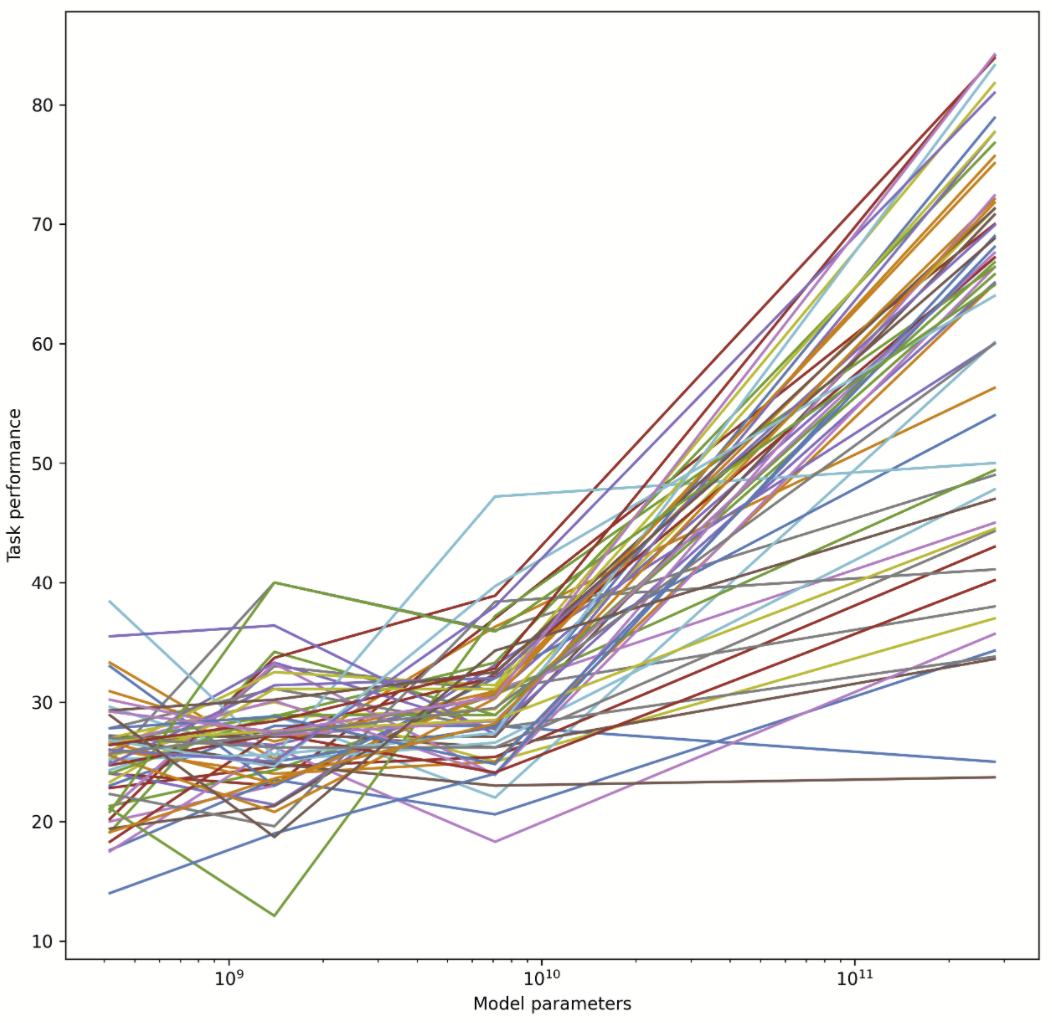
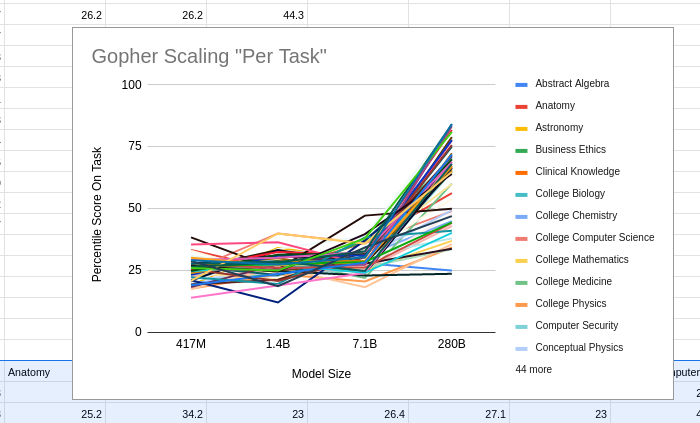
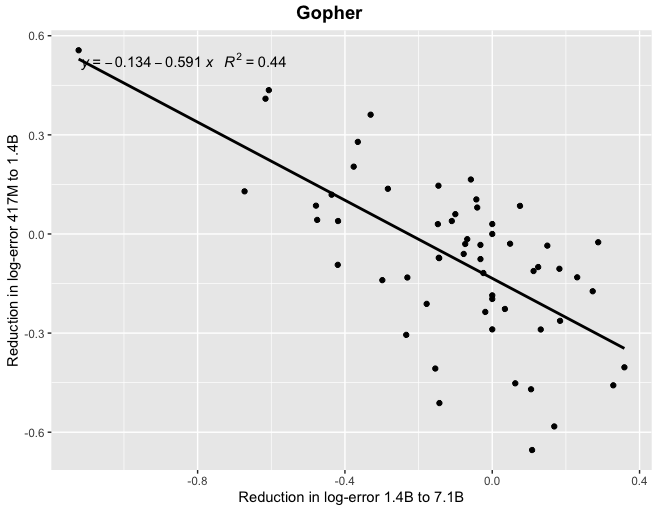
I tried this, and apparently the answer is no. In fact, whether AI has improved on a task recently gives us exactly zero predictive power for how much the next model will improve on the same task. The sheer consistency of this unpredictability is remarkable, almost like a law of statistical thermodynamics. No matter what I plug in, the correlation is always zero! For example, does a task improving rapidly when you go from a small model to a 7B parameter model predict similar improvement when you go from a 7B model to Gopher's 280B? No:
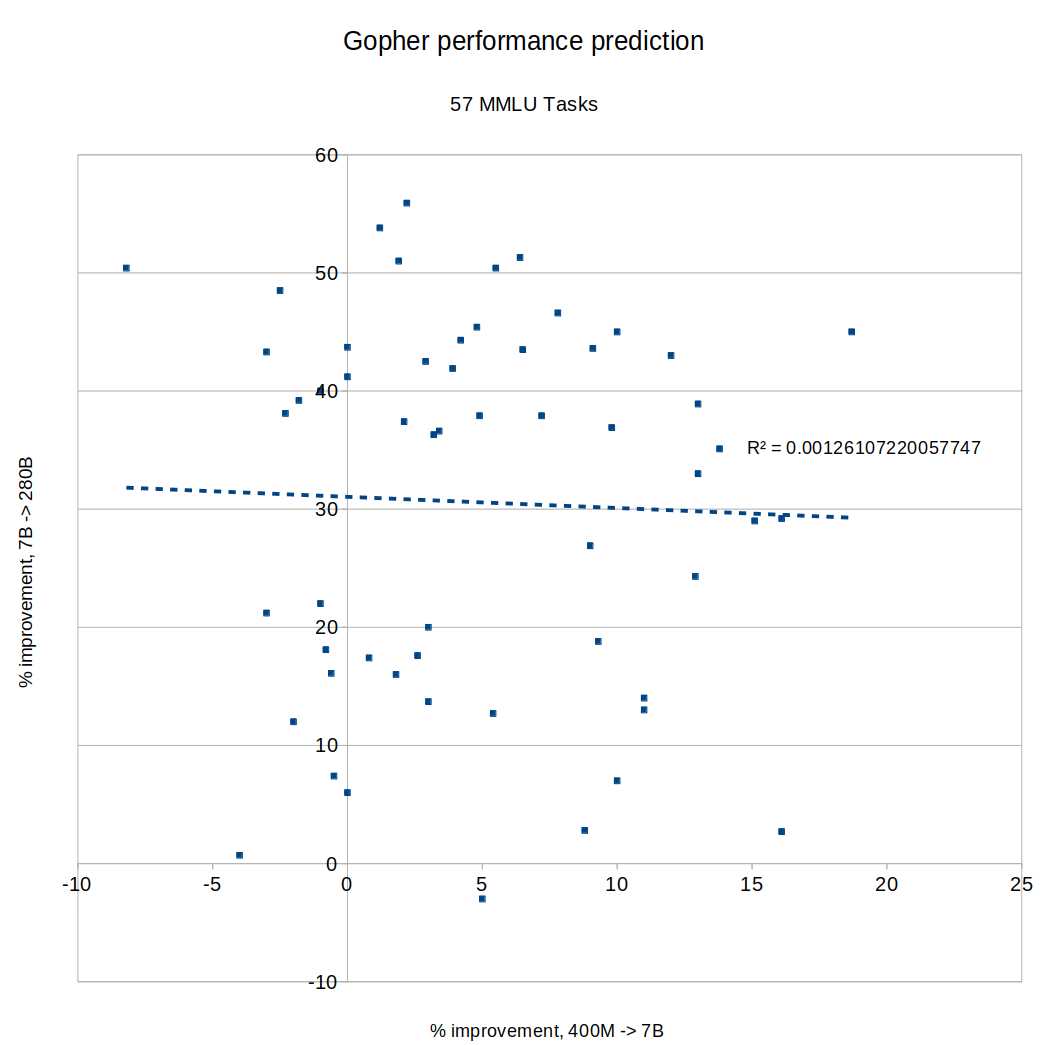
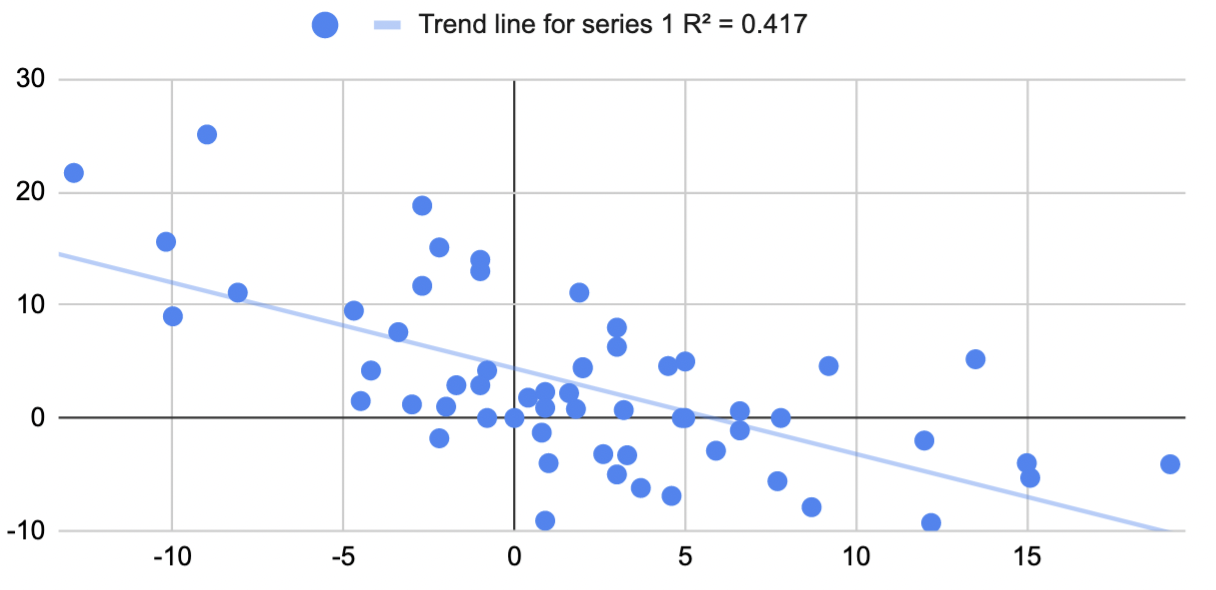
I tried making the same graph with MMLU tasks instead of BIG-bench, same result:
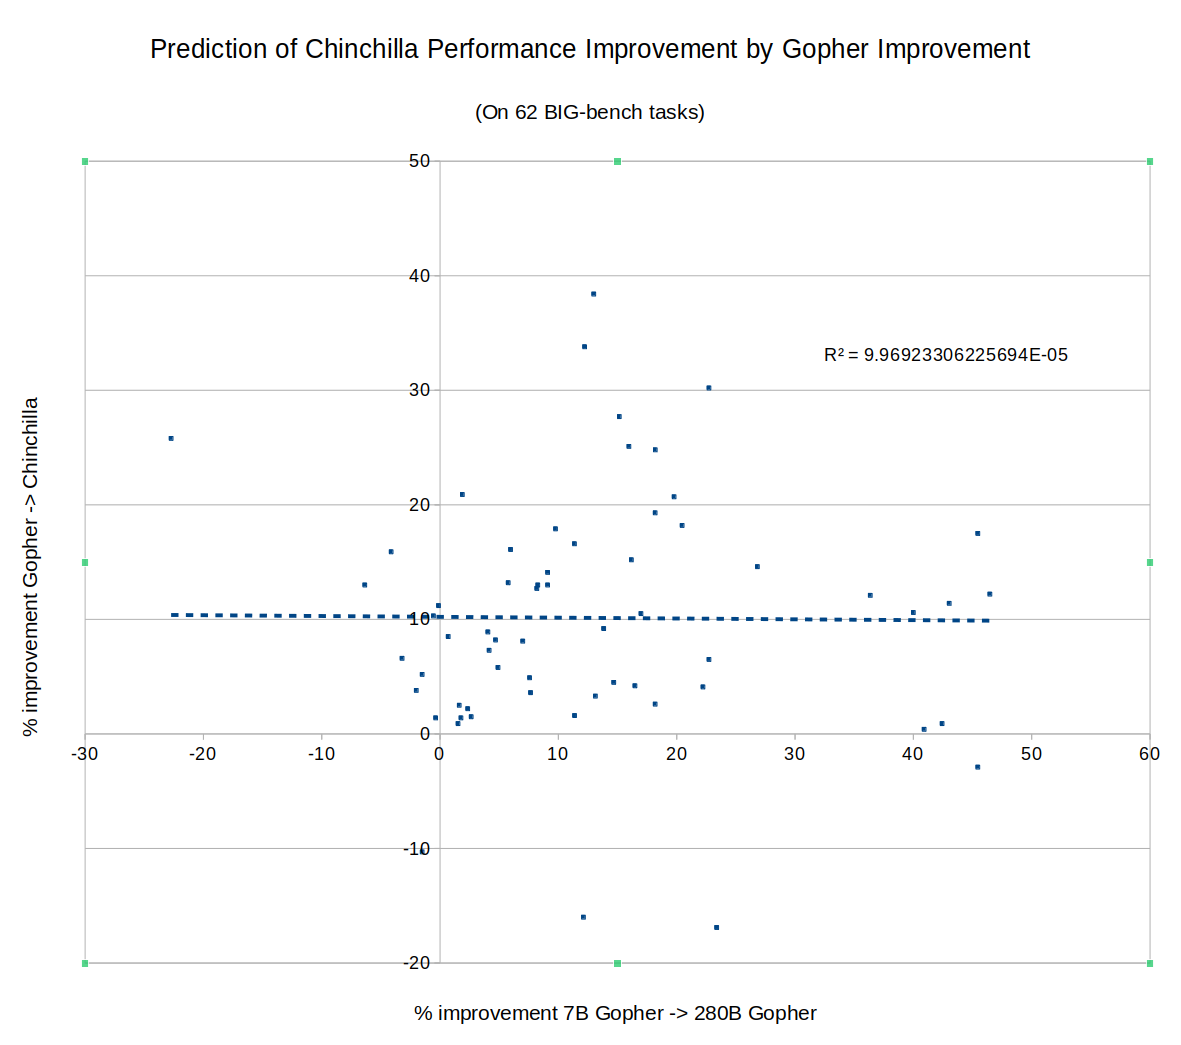
What about DeepMind's new Chinchilla? Did rapid improvement of a task on Gopher predict continued improvement going from Gopher to Chinchilla? Nope:
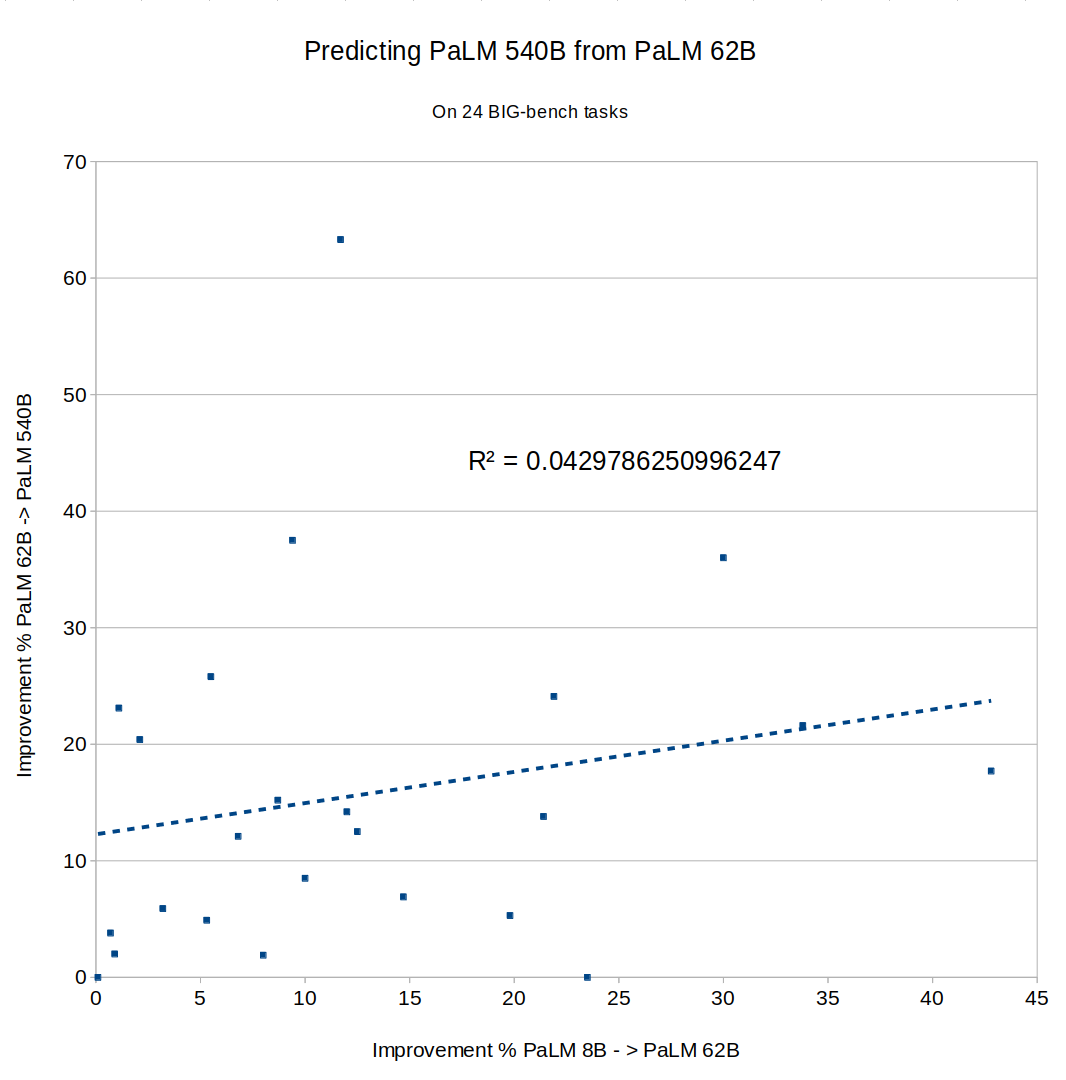
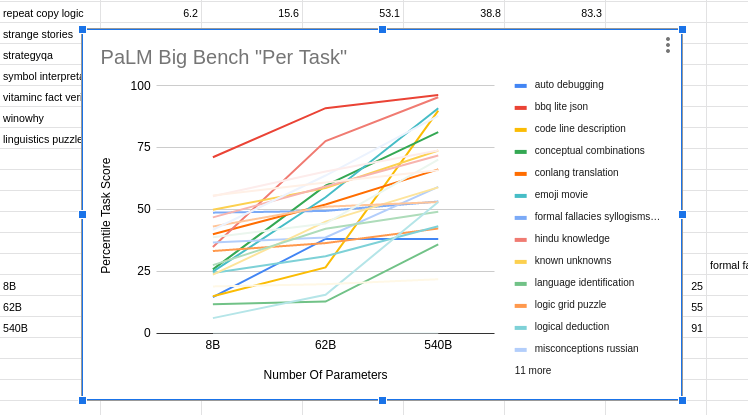
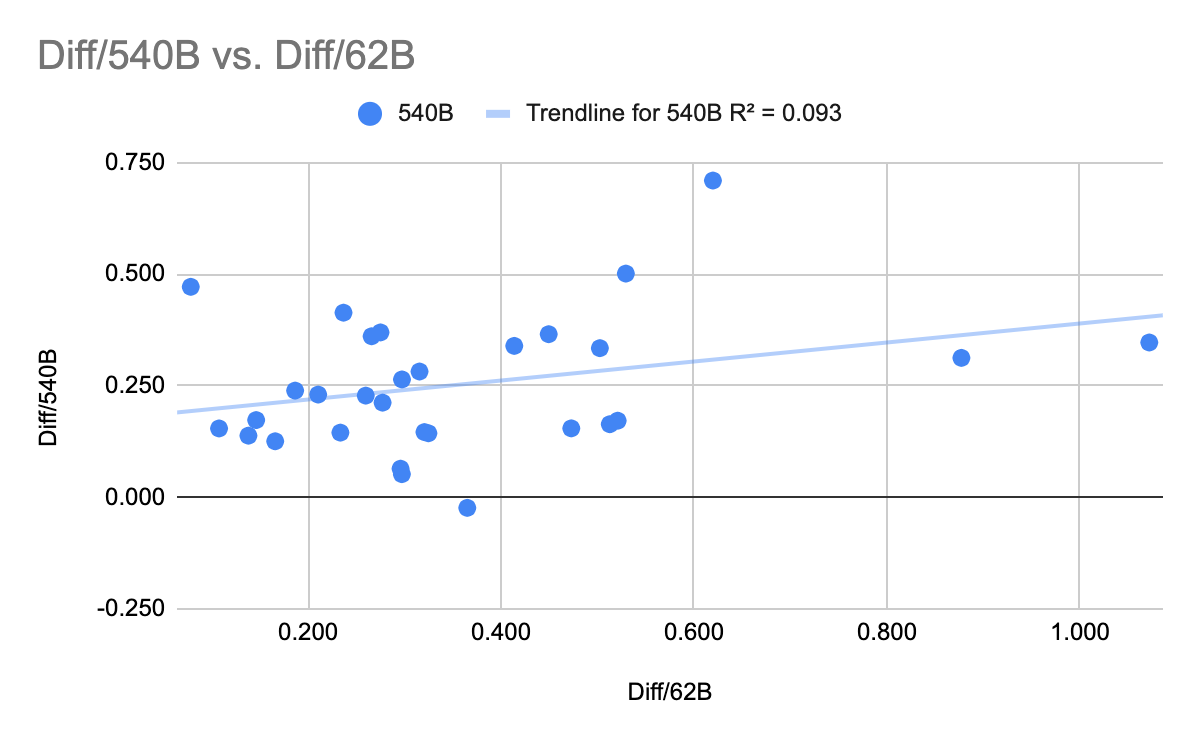
What about Google's PaLM? The full results of PaLM on BIG-bench don't seem to have been published yet, so I couldn't directly compare to Chinchilla or Gopher, but the PaLM paper described an 8B parameter model, a 62B model and a 540B model. Did fast improvement from 8B to 62B predict improvement from 62B to 540B? Not really, R^2 = 0.04:
PaLM also provides data on 30 different NLU benchmark tasks. Plot those and you get the same thing:
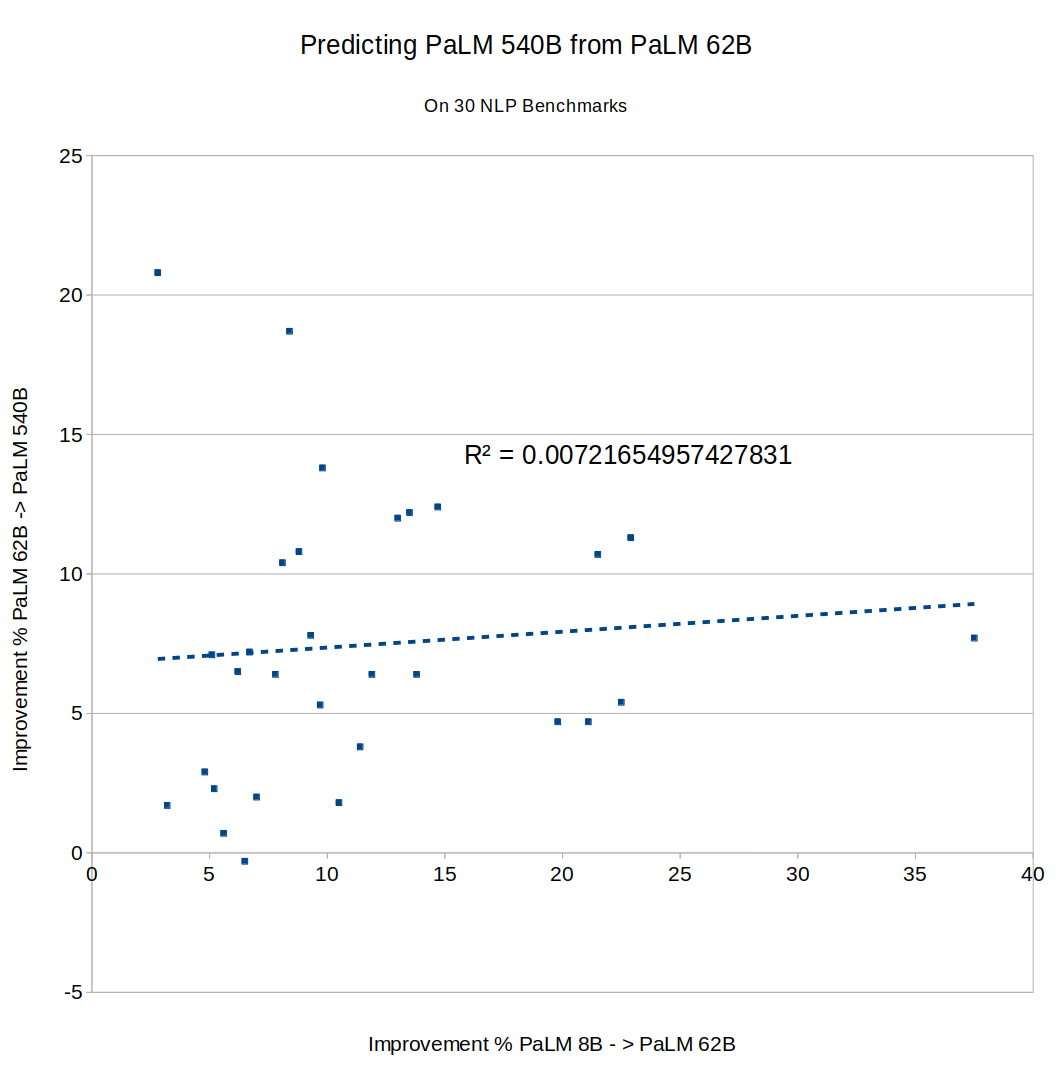
The results here seem pretty clear, but I'm honestly not sure how to interpret them. Before trying this, I assumed you would find that some tasks are "easy" and scale quickly, while others are "hard" and scale slowly. But that would get you high predictability, since fast progress between one pair of models would imply that the task is inherently "easy", and predict (perhaps with some noise) fast progress on the next pair. I didn't see that.
You could also have a theory where tasks scaled similarly (all are of comparable "difficulty"), but there was some noise between model training runs, so that task performance on any given run would bounce up and down around some "true" average value. (Since if you did badly on one run, you'd expect to regress to the mean, and do unusually well on the next.) But I didn't see that either. The two effects (some tasks being intrinsically easier, and individual model runs being noisy) could also cancel out, since one implies a positive correlation and the other implies a negative one... but it seems unlikely that they would exactly cancel every time!
Is AI task performance a type of submartingale, like a stock market index that goes up over time, but where each particular movement is intrinsically unpredictable? Maybe we can compare it to the growth in company profits, where the literature says that companies might grow slowly or quickly, but whether a company has grown fast recently has zero predictive power for future growth. I guess if we knew what we were doing, it wouldn't be called research.
EDIT: By request, here's a Google sheet with the raw data, copy-pasted from the Gopher, PaLM and Chinchilla papers: https://docs.google.com/spreadsheets/d/1Y_00UcsYZeOwRuwXWD5_nQWAJp4A0aNoySW0EOhnp0Y/edit?usp=sharing
EDIT 2: Several people suggested using logits instead of raw percentages. I tried that with the Gopher numbers, still got zero correlation:
EDIT 3: Tamay noted that if you try to predict 7B Gopher from 1B Gopher, you get a negative correlation:
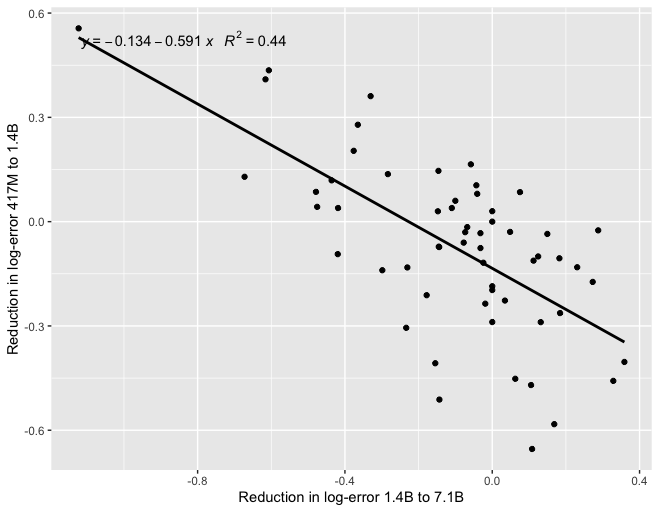
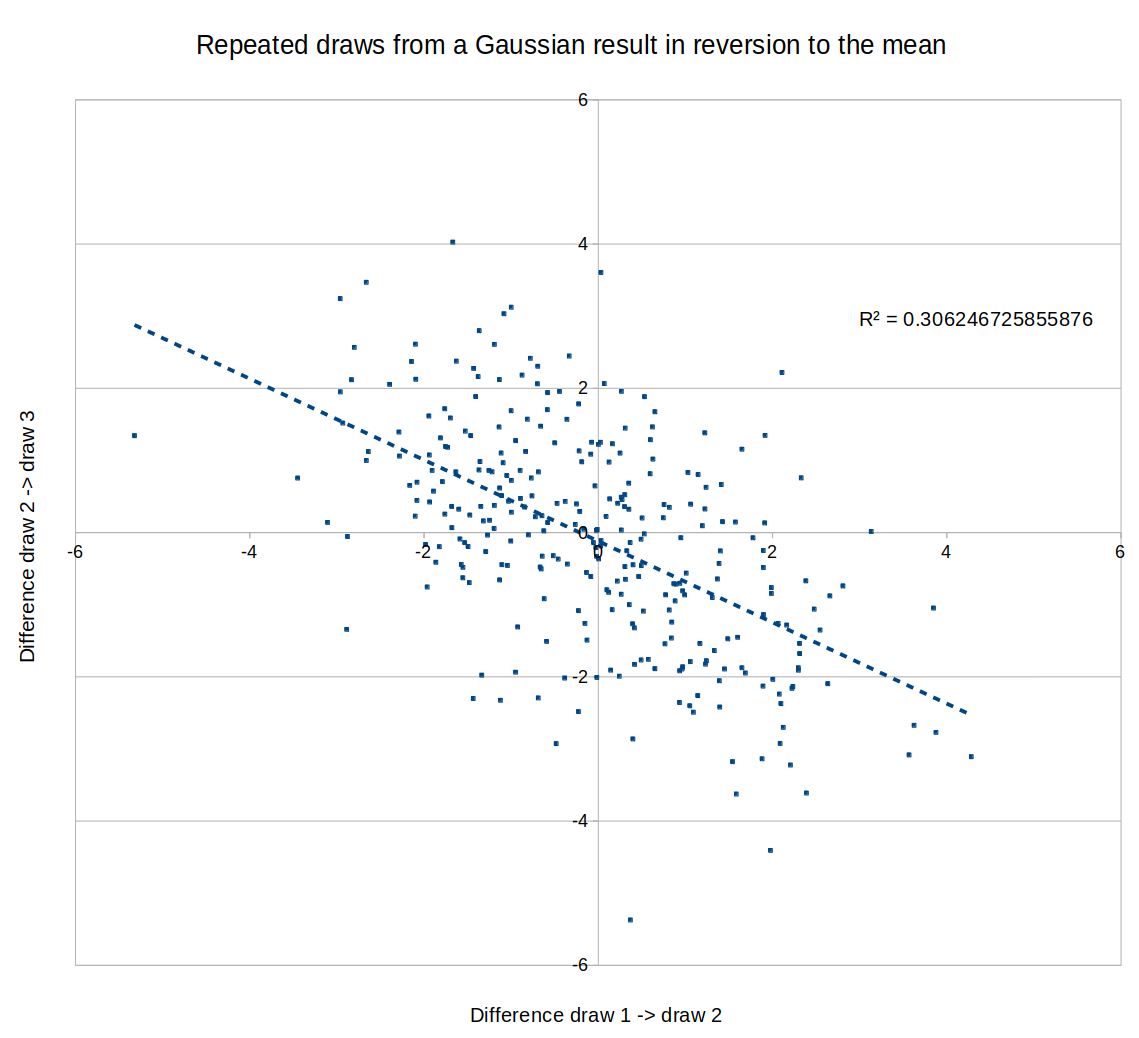
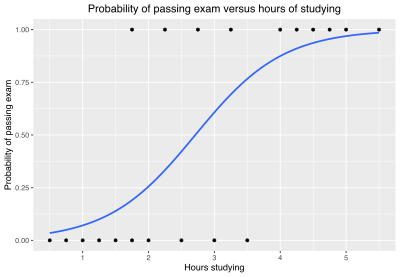
If the models become small enough, maybe this means that scale isn't helping you at that level, so the differences between performances are noise and you should expect mean reversion? Eg., here is a graph of a negative correlation between different "runs", where the "runs" are just draws from a random Gaussian:
I started writing this but lost faith in it halfway through, and realized I was spending too much time on it for today. I figured it's probably a net positive to post this mess anyway although I have now updated to believe somewhat less in it than the first paragraph indicates. Also I recommend updating your expected payoff from reading the rest of this somewhat lower than it was before reading this sentence. Okay, here goes:
{I think people here might be attributing too much of the explanatory weight on noise. I don't have a strong argument for why the explanation definitely isn't noise, but here is a different potential explanation that seems promising to me. (There is a sense in which this explanation is still also saying that noise dominates over any relation between the two variables -- well, there is a formal sense in which that has to be the case since the correlation is small -- so if this formal thing is what you mean by "noise", I'm not really disagreeing with you here. In this case, interpret my comment as just trying to specify another sense in which the process might not be noisy at all.) This might be seen as an attempt to write down the "sigmoids spiking up in different parameter ranges" idea in a bit more detail.
First, note that if the performance on every task is a perfectly deterministic logistic function with midpoint x_0 and logistic growth rate k, i.e. there is "no noise", with k and x_0 being the same across tasks, then these correlations would be exactly 0. (Okay, we need to be adding an epsilon of noise here so that we are not dividing by zero when calculating the correlation, but let's just do that and ignore this point from now on.) Now as a slightly more complicated "noiseless" model, we might suppose that performance on each task is still given by a "deterministic" logistic function, but with the parameters k and x_0 being chosen at random according to some distribution. It would be cool to compute some integrals / program some sampling to check what correlation one gets when k and x_0 are both normally distributed with reasonable means and variances for this particular problem, with no noise beyond that.}
This is the point where I lost faith in this for now. I think there are parameter ranges for how k and x_0 are distributed where one gets a significant positive correlation and ranges where one gets a significant negative correlation in the % case. Negative correlations seem more likely for this particular problem. But more importantly, I no longer think I have a good explanation why this would be so close to 0. I think in logit space, the analysis (which I'm omitting here) becomes kind of easy to do by hand (essentially because the logit and logistic function are inverses), and the outcome I'm getting is that the correlation should be positive, if anything. Maybe it becomes negative if one assumes the logistic functions in our model are some other sigmoids instead, I'm not sure. It seems possible that the outcome would be sensitive to such details. One idea is that maybe if one assumes there is always eps of noise and bounds the sigmoid away from 1 by like 1%, it would change the verdict.
Anyway, the conclusion I was planning to reach here is that there is a plausible way in which all the underlying performance curves would be super nice, not noisy at all, but the correlations we are looking at would still be zero, and that I could also explain the negative correlations without noisy reversion to the mean (instead this being like a growth range somewhere decreasing the chance there is a growth range somewhere else) but the argument ended up being much less convincing than I anticipated. In general, I'm now thinking that most such simple models should have negative or positive correlation in the % case depending on the parameter range, and could be anything for logit. Maybe it's just that these correlations are swamped by noise after all. I'll think more about it.