I have started using a visual metaphor to diagram biases in my attempts to remove and mitigate them in myself. I have found this to be incredibly useful, particularly when dealing with multiple compounding biases.
I view an inference as an interaction between external inputs/premises and the resulting cognitions/conclusions. It can be read either as "if x then y," or "x therefore y." A basic inference looks like this:

A biased inference looks like this:
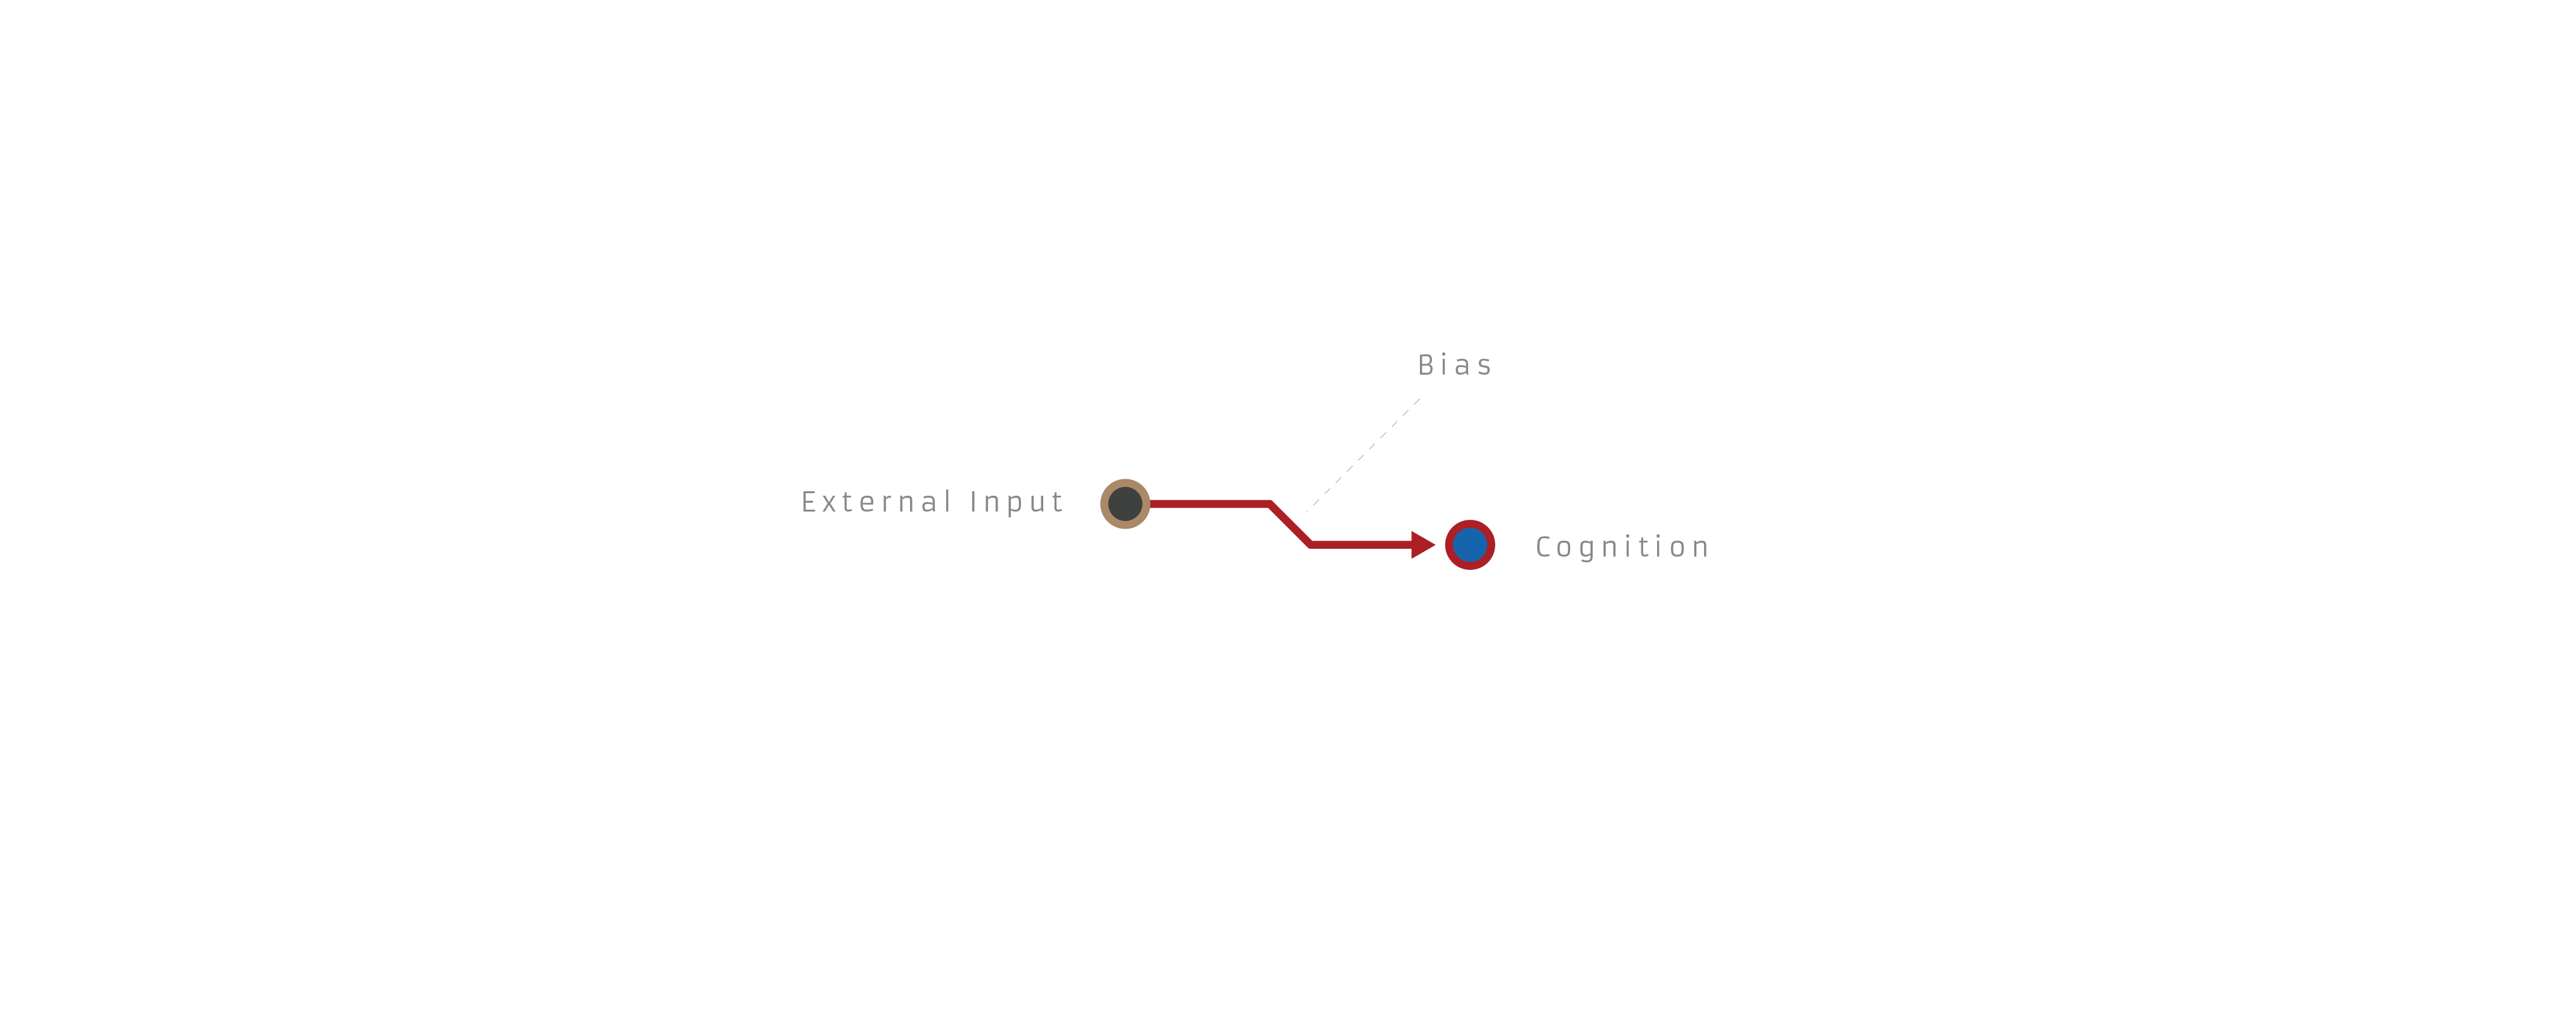
This is obviously a simplification of complex cognitive shit, but it's meant to be more of a functional interface than any kind of theory.
So to run through a few example biases, the fallacy of the undistributed middle:

The planning fallacy:

Planning fallacy corrected:

A little awkward, but it can capture basic failures in Bayesian reasoning as well:

Bayesian reasoning corrected:

And an example of compounding biases resulting in a distorted worldview:

I'm curious if anyone sees downsides to this framework, has other ideas to improve it, or thinks I'm hopelessly naive for even trying to capture human reasoning in a tidy diagram.
It seems that people are focused a lot on the visualization as a tool for removing biases, rather than as a tool for mapping biases. Indeed, visualizations can have value as a summary tool rather than as a way to logically constrain thinking.
Some examples of such visualizations:
In these kinds of visualizations, you get a different way to look at the problem which may appeal to a different sense. I can already see value in this as a way to summarize biased thought.
That said, I do agree with the comments about perhaps tuning the diagram to provide a bit more constraints. Going off of abramdemski's comment above, I think perhaps coloring or changing the lines by the type of reasoning that is happening would be useful. For instance, in your examples, you could have the attributes of "future prediction" for the planning fallacy example or something like "attribute inference" for the Bayesian inference example and maybe undistributed example. By disambiguating between these types in your diagram, you can add rules about the necessary input to correct a biased inference. A "future prediction" line without the "outside view" box would be highly suspect.