The following two charts have been on my mind quite intensively for some time and have had a relatively strong influence on my thinking about dangers for the future development of the financial markets in recent months:
1. Shiller CAPE
An interesting measure of stock market valuation from my perspective is Shiller's CAPE (Cyclically Adjusted PE Ratio). Basically, it is just a price-earnings ratio, but using adjusted earnings over the last 10 years to smooth out the normal cyclical fluctuations.

Source: multpl.com
Admittedly, it is not yet possible to tell from it that valuations and thus share prices will soon be heading downward. But the risk of a crash seems evident to me.
The only time valuations were even higher was in the dot-com bubble around 2000. There is another interesting parallel here. If you look at the statistics on speculation on credit (margin), you see a significant increase in margin positions (FINRA) for some time. At the linked site, you can also find historical data on margin positions, and if you look at 1998-2000, the trend is similar.
2. Historical interest rate trends
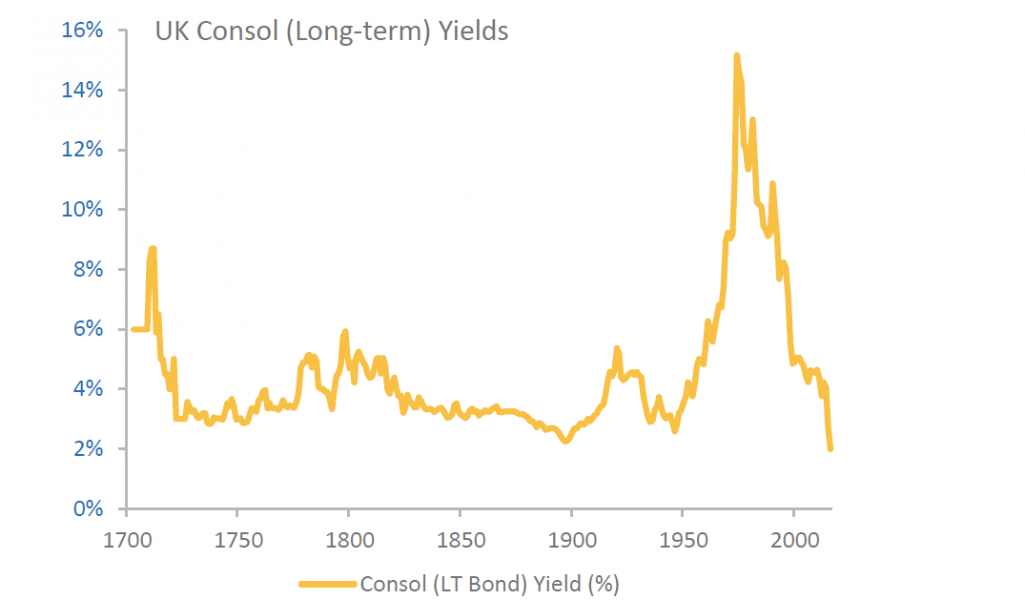
I found the following chart in the book "The Great Demographic Reversal: Ageing Societies, Waning Inequality, and an Inflation Revival" by C. Goodhart and M. Pradhan (The book is very interesting in that it derives a forecast of rising inflation not from monetary developments, but from global demographic developments. I found it well worth reading). While I had read the underlying facts (the ongoing interest rate cuts of the past decades cannot continue) before, it was not until I saw this graphic that I actually became fully aware of the problem.
Source: SUERF
From the graph (UK long term bond yield; it could be drawn analogously for many other countries), I draw some rather uncomfortable conclusions:
(a) The interest rate cuts that have characterized the last 40 years in financial markets can no longer continue. In this respect, we are facing a fundamental change in the development of interest rates (transition from falling interest rates to more or less stable interest rates or to rising interest rates).
b) All my implicit knowledge about the financial markets that I gained as a teenager and an adult was formed in an interest rate environment (falling interest rates) that will soon be a thing of the past. So I can no longer rely on my implicit knowledge.
c) The practical experience and thus the tacit knowledge of the vast majority of players in the global financial markets comes from an environment that will not be the same in the future.
In particular, I think the combination of a) and c) is very worrying. We are facing (or perhaps already in) a fundamental change of direction in the financial markets and almost all players only know the previous environment. And for that we have (see 1.) almost a maximum in equity valuations. This can be a recipe for very interesting times.
3. What follows from this?
First of all, this is not financial advice. I am only writing down my personal conclusions and assessments from the above facts:
a) To infer future average equity returns from the past decades seems to me quite dangerous.
b) The valuation level (Shiller CAPE) and the elimination of the interest rate reduction effect for stock valuations indicate that expected future equity returns will probably be significantly lower than those of past decades.
c) The change in the interest rate environment and the inexperience of the vast majority of players with such a change can lead to price movements that go far beyond usual price movements in the business cycle.
d) Even for a relatively short investment horizon, the range of possible returns seems extremely wide to me. If I had to give a range for the price development (e.g. SP 500) until the end of 2022, where I am 90% sure that the price development will lie within this range, my current estimate would be from approx. +30% to - 60%.

The 2000-2021 VIX has averaged 19.7, sp500 annualized vol 18.1.
From a 2ndary source: "The mean of the realistic volatility risk premium since 2000 has been 11% of implied volatility, with a standard deviation of roughly 15%-points" from https://www.sr-sv.com/realistic-volatility-risk-premia/ . So 1/3 of the time the premia is outside [-4%,26%], which swamps a lot of vix info about true expect vol.
-60% would the worst draw down ever, the prior should be <<1%. However, 8 years have been above 30% since 1928 (9%), seems you're using a non-symetric CI.
The reasoning for why there'd be such a drawdown is backwards in OP: because real rates are so low the returns for owning stocks has declined accordingly. If you expect 0% rates and no growth stocks are priced reasonably, yielding 4%/year more than bonds. Thinking in the level of rates not changes to rates makes more sense, since investments are based on current projected rates. A discounted cash flow analysis works regardless of how rates change year to year. Currently the 30yr is trading at 2.11% so real rates around the 0 bound is the consensus view.