In recent months and years I have seen sober analyses of compute price-performance suggesting that the price-performance in computing (that is, the amount of calculations per second that you can buy for a dollar) has a doubling time of something like 2-3 years. I do not think these figures are good predictors of future expectations, and I wish to explain why.
Over the years I have often returned to Kurzweil's[1] plot of price-performance in the 20th century. I occasionally update the plot on my own and marvel that the trend has persisted essentially unabated since it was published, illustrating a continuous and consistent trend from 1900 through 2023. For your reference and for the sake of clarity I have taken the original plot and added one recent point, the AMD RX 7600 GPU, which boasts 21.4 TFLOP/s (single-precision) at a price point of $269.99 as of this week. Take my word for it that the plots between 1995 and 2023 remain essentially on-trend.
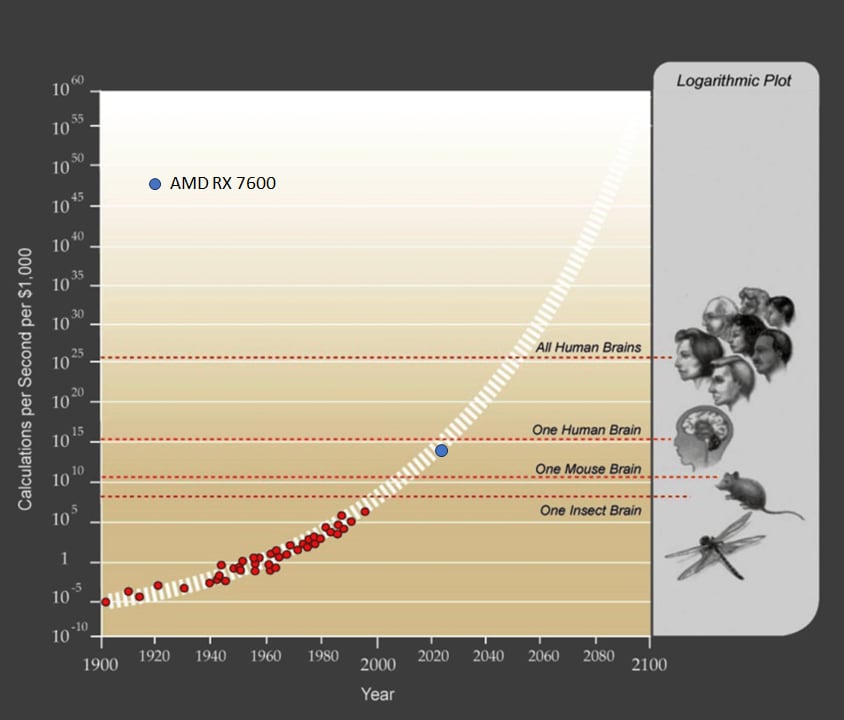
This plot[2] has no "doubling time" because it is super-exponential, i.e. there is an exponent inside the exponent, and the effective doubling time gets shorter over time. I have not found any published reference to how the white dashed band is calculated, but my own best fit line is:
where C is price-performance of compute in FLOP/s per $1000 and t in this case is years-since-1900. The instantaneous doubling time for this trend as of today would be about 0.93 years, less than half of even the most Pollyannaish of the recent forecasts. And the instantaneous doubling time obviously gets shorter each year.
The discrepancy between this <1 year doubling time and the >2 year doubling time observed in more recent publications is explained by the fact that trends calculated on the basis of narrow, recent time-frames will only capture one paradigm, e.g. the "GPU paradigm", which, like all individual paradigms in technology, exhibits S-curve behavior, starting out slow, accelerating, and then flattening. I also note that serious authors tend to present doubling-time figures that lean in the pessimistic direction.
Of course, it is entirely possible that 2023 marks the end of the validity of the above super-exponential trend. Perhaps, for some reason, no new computing paradigm arises to put us back on the white dashed band.
I feel it is important to consider that predictions for the end of the decade are wildly different depending on whether we extrapolate using this super-exponential trend or a "merely" exponential trend. Using an exponential extrapolation from today, we would expect compute to be roughly 10x cheaper per FLOP/s by 2030. Using the super-exponential extrapolation projects something closer to 1000x improvement in price-performance. Take these numbers as rough, since the extrapolations depend very much on the minutiae of how you do your curve fit. Regardless of the details, it is a difference of orders of magnitude.
I don't know how exactly we could achieve 1000x price-performance in 7 years, but responsible forecasting requires that we be open to the possibility of unforeseeable paradigm shifts, and I wouldn't want to bet against a curve that has held up for 123 years. If you had tried to make forecasts over the timescale of a decade using an exponential trend at any point over the last 100 years, you would have been consistently wrong by a margin that only increases with each decade. It seems particularly important that we avoid being wrong this decade.
Discussion in the comments prompted me to add this table of data to the original post, so that it would be more visible and provide a shared frame of reference:
| Hardware | Precision | TFLOPS | Price ($) | FLOPS/$1000 |
| Nvidia GeForce RTX 4090 | FP8 | 82.58 | $1,600 | 5.16E+13 |
| AMD RX 7600 | FP8 | 21.5 | $270 | 7.96E+13 |
| TPU v5e | INT8 | 393 | $4730* | 8.31E+13 |
| H100 | FP16 | 1979 | $30,603 | 6.47E+13 |
| H100 | FP8 | 3958 | $30,603 | 1.29E+14 |
*The price point of the TPU v5e is estimated based on a variety of sources, and adjusted based on my calculations from the hourly usage rates.
- ^
I can't figure out if Kurzweil was the one to originally publish this plot, but I know that the first place I saw it was in The Singularity is Near in 2005.
- ^
For reference, the "one human brain" estimate comes from FLOPS = 86 billion neurons×1000 synapses/neuron×200 Hz = 10^16 - 10^17 FLOPSa mode of estimation that I suspect Kurzweil would admit is tendentious.
There are many different types of "TFLOPS" that are not directly comparable, independent of precision. The TPU v5e does not have anything remotely close to 393 TFLOPs of general purpose ALU performance. The number you are quoting is the max perf of its dedicated matmul ALU ASIC units, which are most comparable to nvidia tensorcores, but worse as they are less flexible (much larger block volumes).
The RTX 4090 has ~82 TFLOPs of general purpose SIMD 32/16 bit flops - considerably more than the 51 or 67 TFLOPs of even the H100. I'm not sure what the general ALU flops of the TPU are, but it's almost certainly much less than the H100 and therefore less than the 4090.
The 4090's theoretical tensorcore perf is 330/661 for fp16[1] and 661/1321[2][3] for fp8 dense/sparse (sparse using nvidia's 2:1 local block sparsity encoding), and 661 int8 TOPs (which isn't as useful as fp8 of course). You seem to be using the sparse 2:1 fp8 tensorcore or possibly even 4bit pathway perf for H100, so that is most comparable. So if you are going to use INT8 precision for the TPU, well the 4090 has double that with 660 8-bit integer TOPS for about 1/4th the price. The 4090 has about an OOM lead in low precision flops/$ (in theory).
Of course what actually matters is practical real world benchmark perf due to the complex interactions between RAM and cache quantity, various types of bandwidths (on-chip across various caches, off-chip to RAM, between chips etc) and so on, and nvidia dominates in most real world benchmarks.
wikipedia ↩︎
toms hardware ↩︎
nvidia ada gpu arch ↩︎