[this is a linkpost to Analysis of World Records in Speedrunning]
ETA: a more recent analysis can be found here.
TL;DR: I have scraped a database of World Record improvements for fastest videogame completition for several videogames, noted down some observations about the trends of improvement and attempted to model them with some simple regressions. Reach out if you'd be interested in researching this topic!
Key points
- I argue that researching speedrunning can help us understand scientific discovery, AI alignment and extremal distributions. More.
- I’ve scraped a dataset on world record improvements in videogame speedrunning. It spans 15 games, 22 categories and 1462 runs. More.
- Most world record improvements I studied follow a diminishing returns pattern. Some exhibit successive cascades of improvements, with continuous phases of diminishing returns periodically interrupted by (presumably) sudden discoveries that speed up the rate of progress. More.
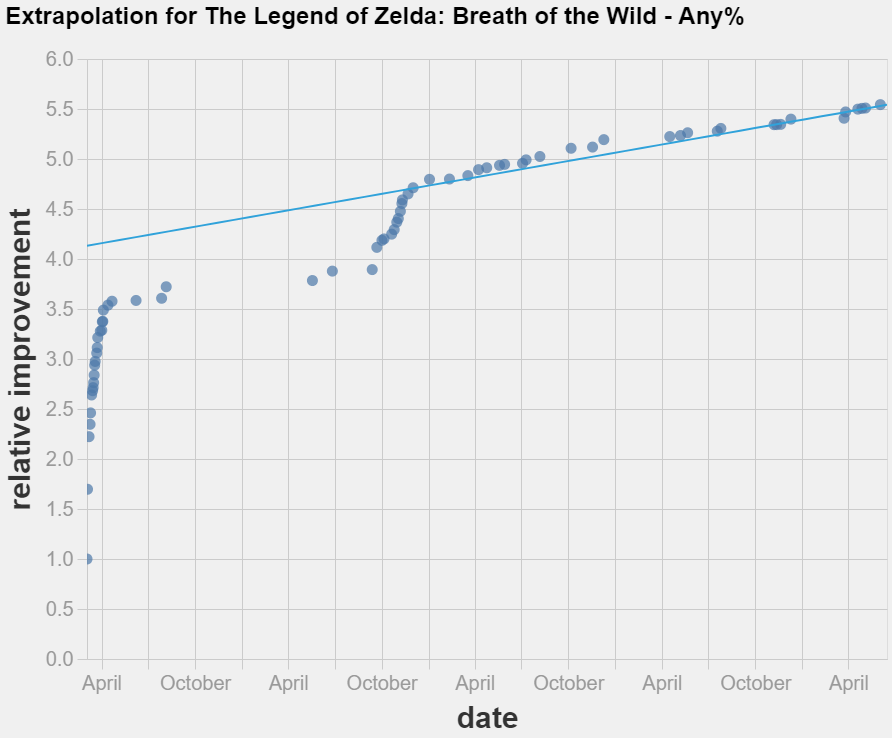
- Simple linear extrapolation techniques could not improve on just guessing that the world record will not change in the near future. More.
- Possible next steps include trying different extrapolation techniques, modelling the discontinuities in the data and curating a dataset of World Record improvements in Tool Assisted Speedruns. More.
The script to scrape the data and extrapolate it is available here. A snapshot of the data as of 30/07/2021 is available here.

Feedback on the project would be appreciated. I am specially keen on discussion about:
- Differences and commonalities to expect between speedrunning and technological improvement in different fields.
- Discussion on how to mathematically model the discontinuities in the data.
- Ideas on which techniques to prioritize to extrapolate the observed trends.
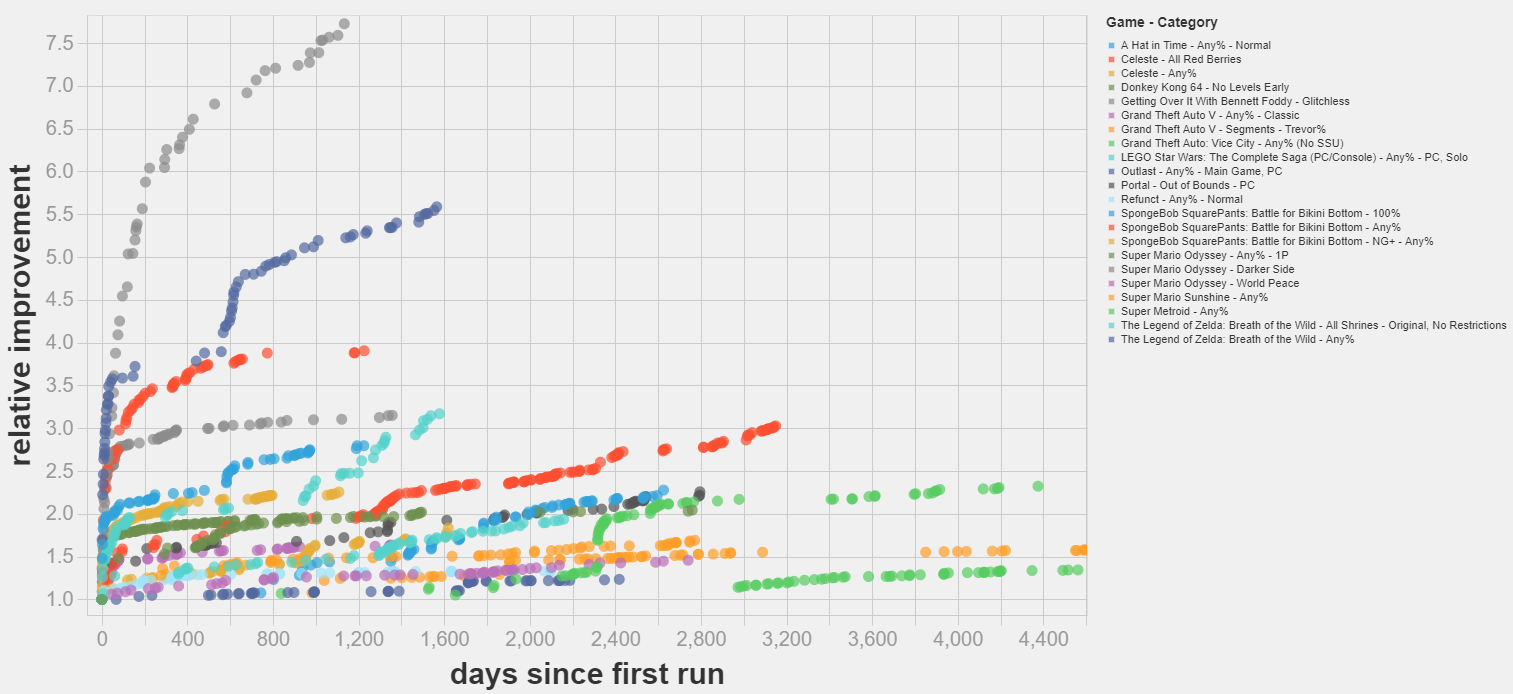
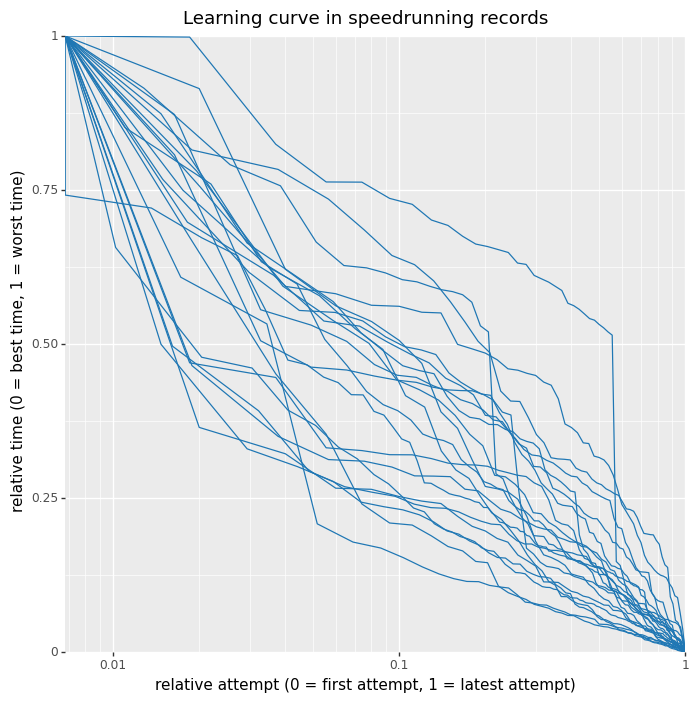
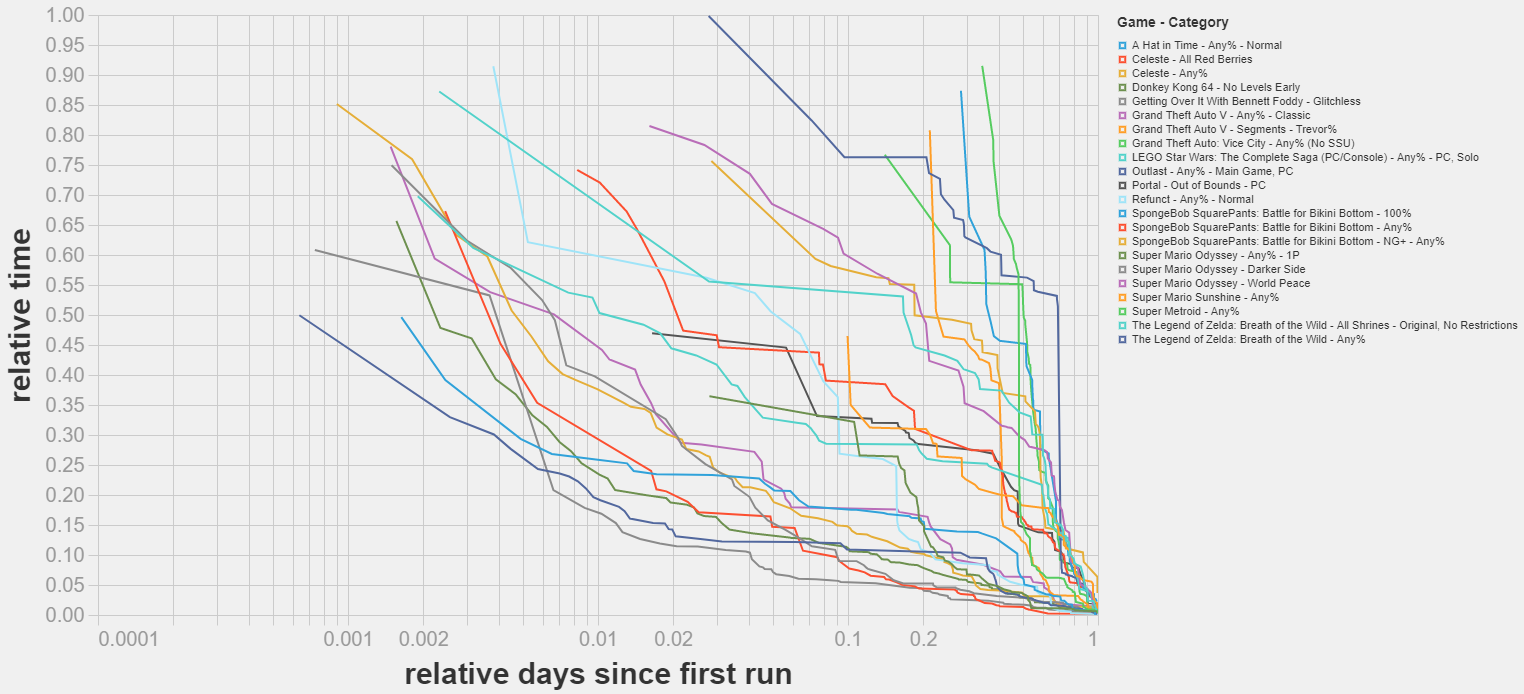
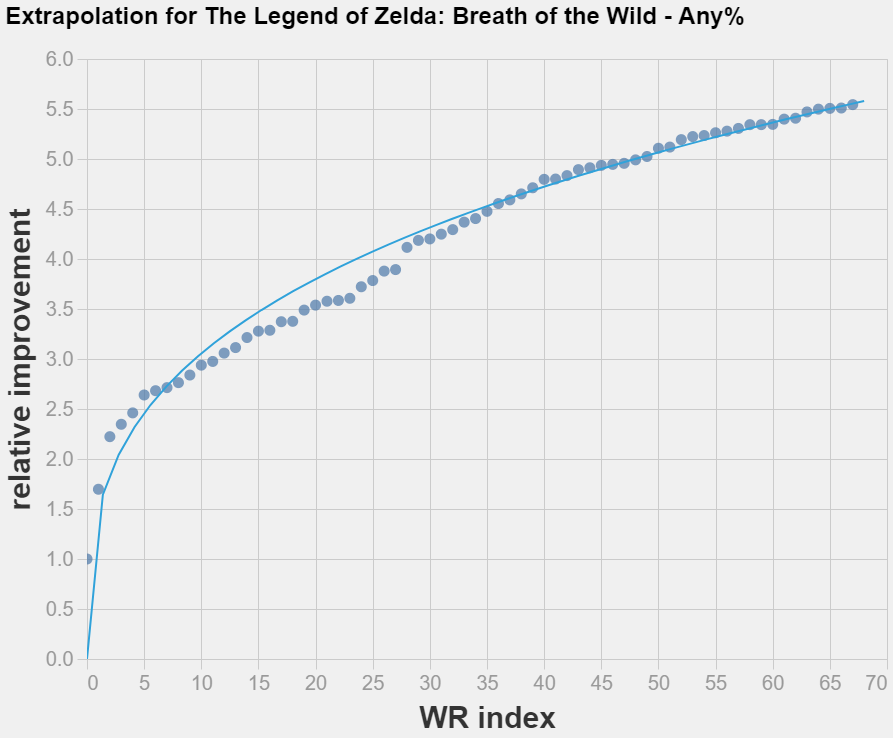
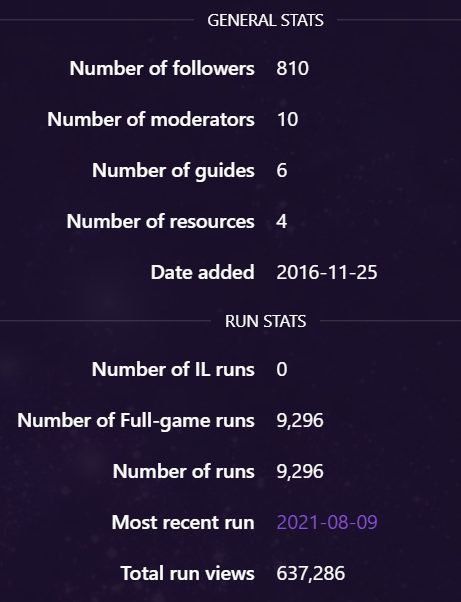
Is there any way to estimate how many cumulative games that speedrunners have run at a given point? It is intuitive that progress should be related to amount of effort put into it, and that the more people play a game, the further they can push the limits, which may explain a lot of the apparent heterogeneity, even if all games have a similar experience curve exponent.
It's also interesting because the form might suggest that each attempt has an equal chance of setting a record (equal-odds rule; "On the distribution of time-to-proof of mathematical conjectures", Hisano & Sornette 2012 for math proof attempts; counting-argument in "Scaling Scaling Laws with Board Games", Jones 2021), which shows how progress comes from brute force thinking.
We actually wrote a more up to date paper here
https://arxiv.org/abs/2304.10004