All of Amandango's Comments + Replies

An update: We've set up a way to link your LessWrong account to your Elicit account. By default, all your LessWrong predictions will show up in Elicit's binary database but you can't add notes or filter for your predictions. 

If you link your accounts, you can:
* Filter for and browse your LessWrong predictions on Elicit (you'll be able to see them by filtering for 'My predictions')
* See your calibration for LessWrong predictions you've made that have resolved
* Add notes to your LessWrong predictions on Elicit
* Predict on LessWrong questions in the Elic... (read more)

This was a good catch! I did actually mean world GDP, not world GDP growth. Because people have already predicted on this, I added the correct questions above as new questions, and am leaving the previous questions here for reference:

1%
2%
3%
4%
5%
6%
7%
8%
9%
10%
11%
12%
13%
14%
15%
16%
17%
18%
19%
20%
21%
22%
23%
24%
25%
26%
27%
28%
29%
30%
31%
32%
33%
34%
35%
36%
37%
38%
39%
40%
41%
42%
43%
44%
45%
46%
47%
48%
49%
50%
51%
52%
53%
54%
55%
56%
57%
58%
59%
60%
61%
62%
63%
64%
65%
66%
67%
68%
69%
70%
71%
72%
73%
74%
75%
76%
77%
78%
79%
80%
81%
82%
83%
84%
85%
86%
87%
88%
89%
90%
91%
92%
93%
94%
95%
96%
97%
98%
99%
1%
99%
1%
2%
3%
4%
5%
6%
7%
8%
9%
10%
11%
12%
13%
14%
15%
16%
17%
18%
19%
20%
21%
22%
23%
24%
25%
26%
27%
28%
29%
30%
31%
32%
33%
34%
35%
36%
37%
38%
39%
40%
41%
42%
43%
44%
45%
46%
47%
48%
49%
50%
51%
52%
53%
54%
55%
56%
57%
58%
59%
60%
61%
62%
63%
64%
65%
66%
67%
68%
69%
70%
71%
72%
73%
74%
75%
76%
77%
78%
79%
80%
81%
82%
83%
84%
85%
86%
87%
88%
89%
90%
91%
92%
93%
94%
95%
96%
97%
98%
99%
1%
99%

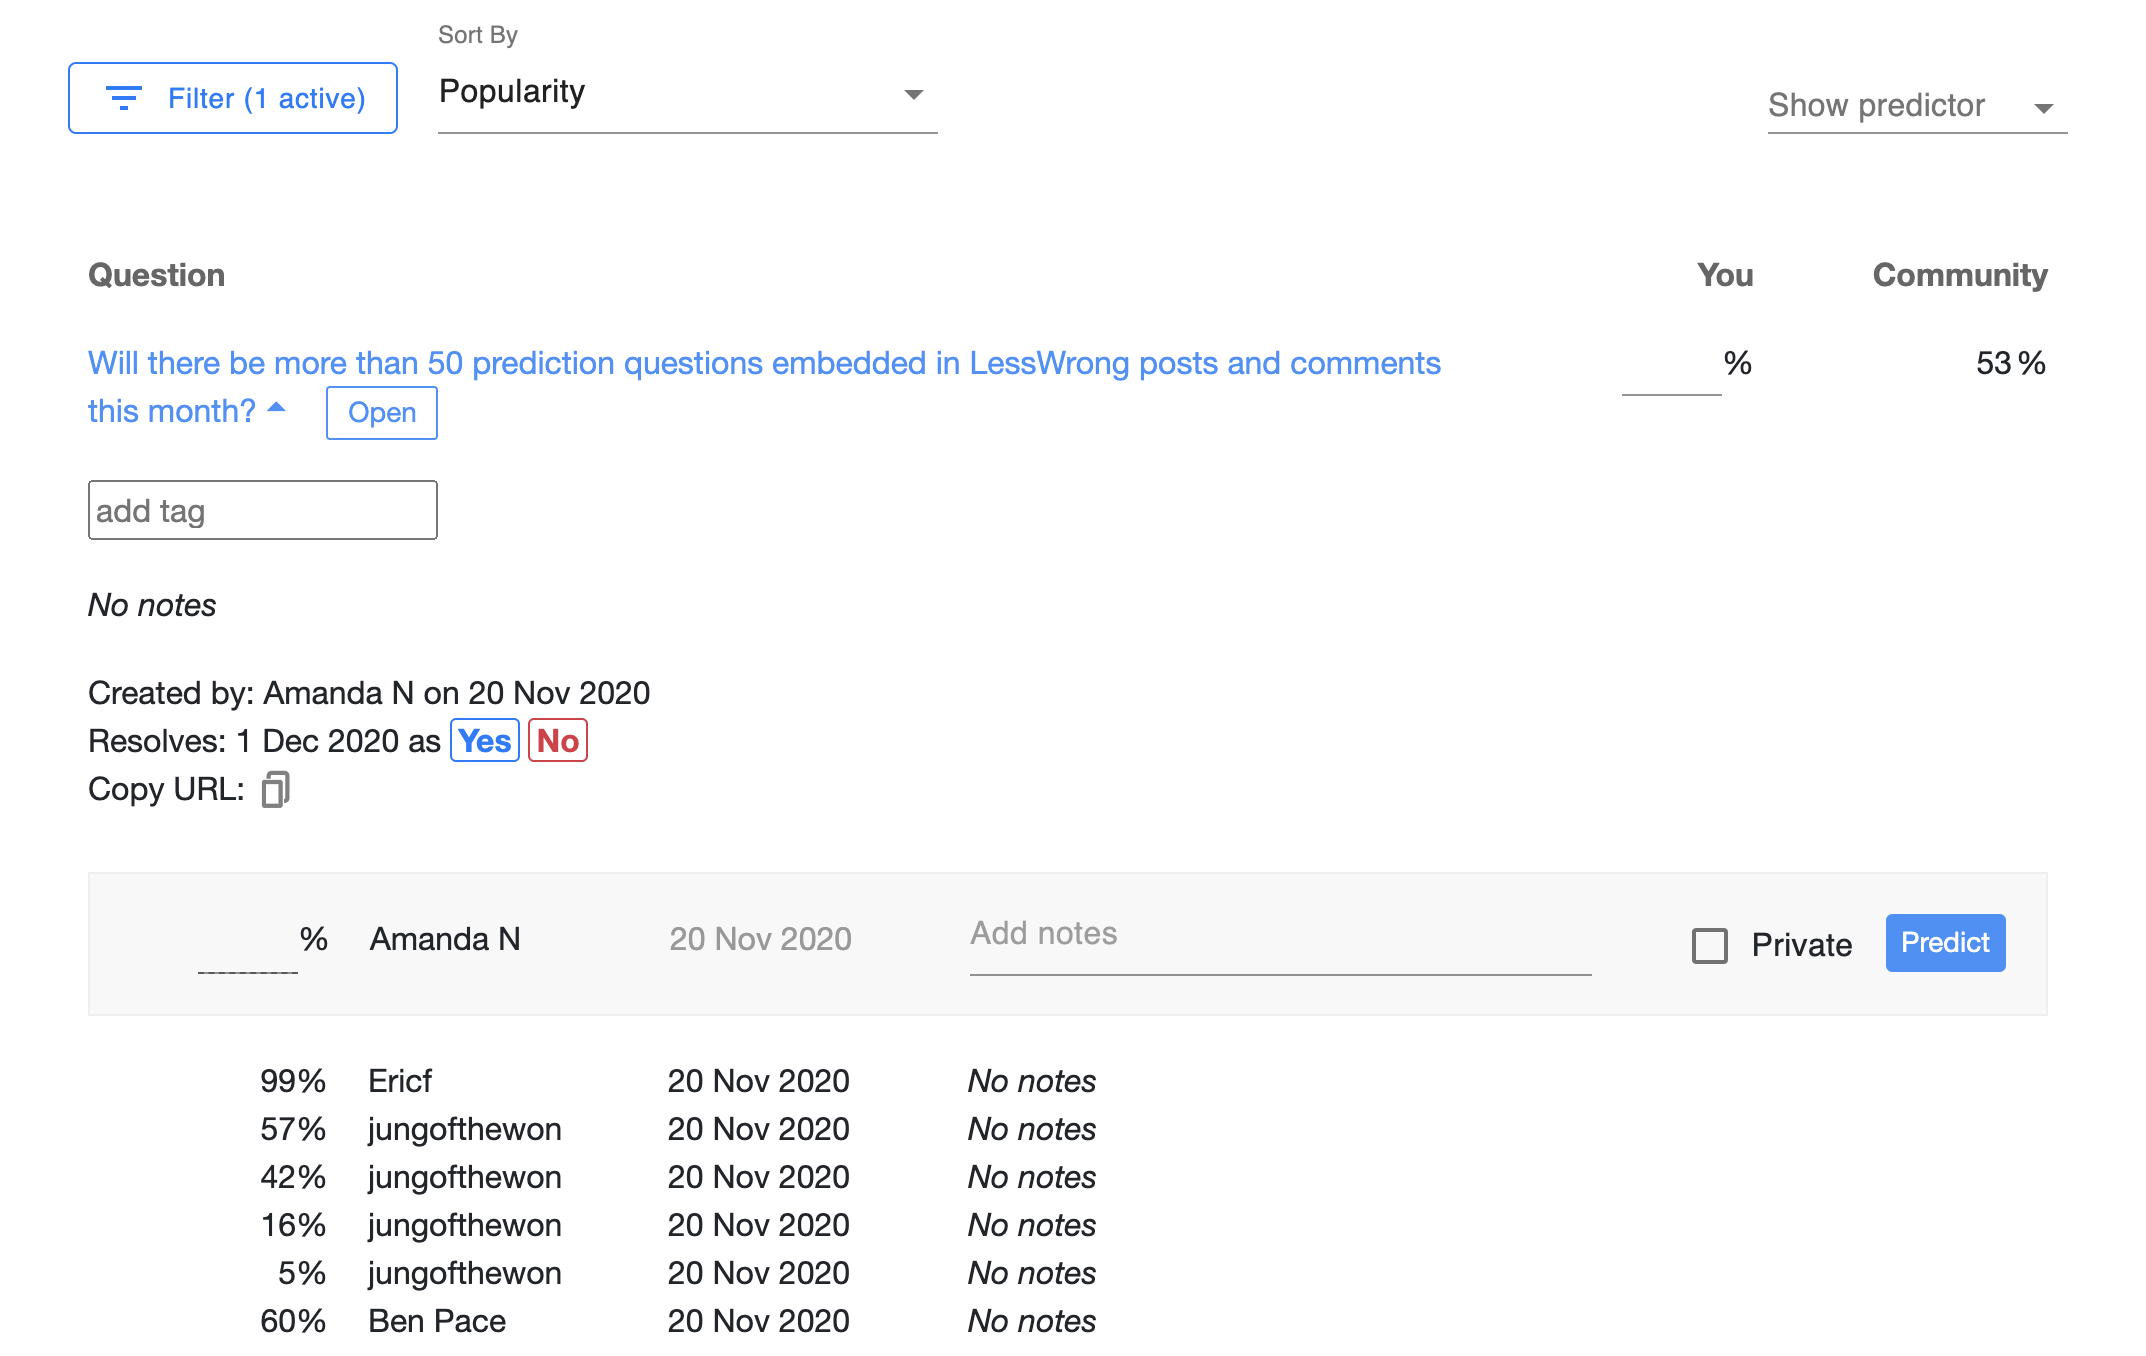
If you're the question author, you can resolve your question on Elicit by clicking 'Yes' or 'No' in the expanded question!

How to add your own questions:

  1. Go to elicit.org/binary
  2. Type your question into the field at the top
  3. Click on the question title, and click the copy URL button
  4. Paste the URL into the LessWrong editor

See our launch post for more details!

You can search for the question on elicit.org/binary and see the history of all predictions made! E.G. If you copy the question title in this post, and search by clicking Filter then pasting the title into "Question title contains," you can find the question here.

1jmh
Is it just me or do all those prediction assessments from jungofthewon point to a rather undesirable feature of the tool?

I'm counting using this to express credence on claims as a non-prediction use!

Thanks!! It's primarily intended for prediction, but I feel excited about people experimenting with different ways of using this and seeing which are most useful & how they change discussions, so am interested to see what happens if you use it for other purposes too.

I don't feel super strongly about this, but think it'd be fun to bet on if anyone disagrees with me (here are the Metaculus resolution details): 

When will a technology replace screens? (snapshot link here)

This is a really good point, thanks for bringing this up! We'll look into how to improve this.

Yeah this seems pretty reasonable. It's actually stark looking at the Our World in Data – that seems really high per year. Do you have your model somewhere? I'd be interested to see it.

2orthonormal
It's not explicit. Like I said, the terms are highly dependent in reality, but for intuition you can think of a series of variables Xk for k from 1 to N, where Xk equals 1/k with probability 1/√N. And think of N as pretty large. So most of the time, the sum of these is dominated by a lot of terms with small contributions. But every now and then, a big one hits and there's a huge spike. (I haven't thought very much about what functions of k and N I'd actually use if I were making a principled model; 1/k and 1/√N are just there for illustrative purposes, such that the sum is expected to have many small terms most of the time and some very large terms occasionally.)

A rough distribution (on a log scale) based on the two points you estimated for wars (95% < 1B people die in wars, 85% < 10M people die in wars) gives a median of ~2,600 people dying. Does that seem right?

5orthonormal
No. My model is the sum of a bunch of random variables for possible conflicts (these variables are not independent of each other), where there are a few potential global wars that would cause millions or billions of deaths, and lots and lots of tiny wars each of which would add a few thousand deaths. This model predicts a background rate of the sum of the smaller ones, and large spikes to the rate whenever a larger conflict happens. Accordingly, over the last three decades (with the tragic exception of the Rwandan genocide) total war deaths per year (combatants + civilians) have been between 18k and 132k (wow, the Syrian Civil War has been way worse than the Iraq War, I didn't realize that). So my median is something like 1M people dying over the decade, because I view a major conflict as under 50% likely, and we could easily have a decade as peaceful (no, really) as the 2000s.

I noticed that your prediction and jmh's prediction are almost the exact opposite:

  • Teerth: 80%: No human being would be living on another celestial object (Moon, another planet or asteroid) (by 2030)
  • jmh: 90%: Humans living on the moon (by 2030)

(I plotted this here to show the difference, although this makes the assumption that you think the probability is ~uniformly distributed from 2030 – 2100). Curious why you think these differ so much? Especially jmh, since 90% by 2030 is more surprising - the Metaculus prediction for when the next human being will walk... (read more)

2Teerth Aloke
Difference in intuition. Otherwise, I think that there will be no state-sponsored space colonization program- and there will be no incentive for any private organization to establish a colony - given the price of sending and sustaining.

Thank you for putting this spreadsheet database together! This seemed like a non-trivial amount of work, and it's pretty useful to have it all in one place. Seeing this spreadsheet made me want:

  • More consistent questions such that all these people can make comparable predictions
  • Ability to search and aggregate across these so we can see what the general consensus is on various questions
     

I thought the 2008 GCR questions were really interesting, and plotted the median estimates here. I was surprised by / interested in:

  • How many more deaths were expected fr
... (read more)

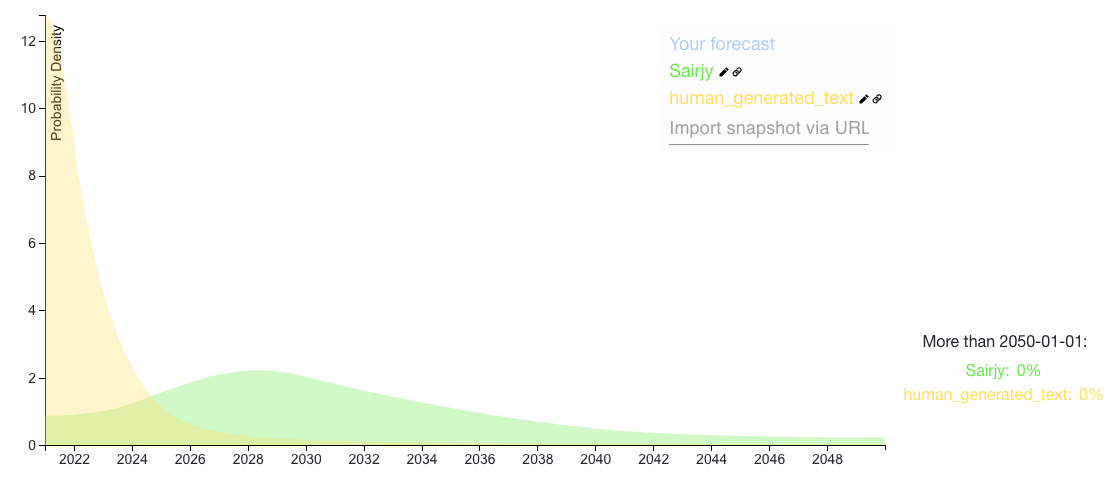
This is a really great conditional question! I'm curious what probability everyone puts on the assumption (GPT-N gets us to TAI) being true (i.e. do these predictions have a lot of weight in your overall TAI timelines)?

I plotted human_generated_text and sairjy's answers:

Here's a colab you can use to do this! I used it to make these aggregations

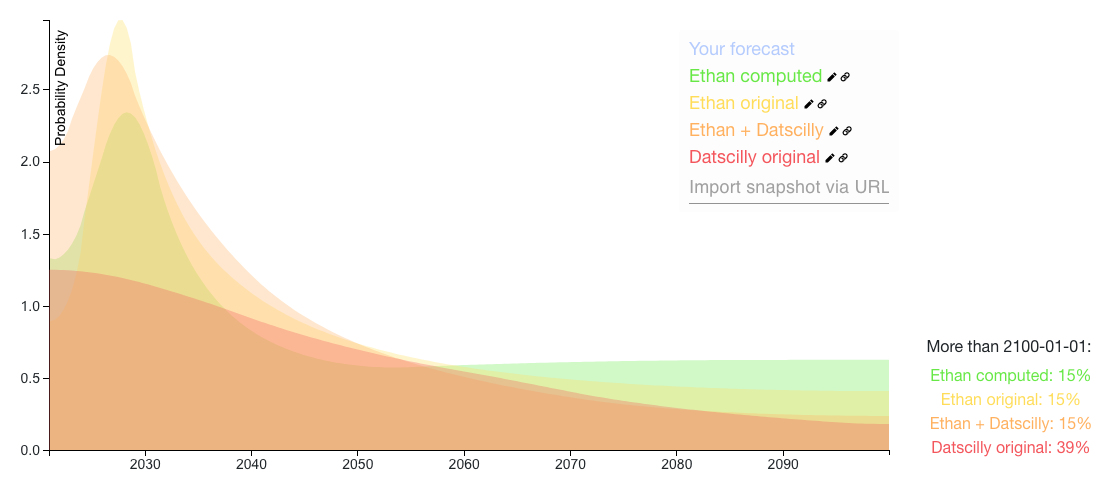
The Ethan + Datscilly distribution is a calculation of:

- 25% * Your inside view of prosaic AGI

- 60% * Datscilly's prediction (renormalized so that all the probability < 2100)

- 15% * We get AGI > 2100 or never

This has an earlier median (2040) than your original distribution (2046).

(Note for the colab: You can use this to run your own aggregations by plugging in Elicit snapshots of the distributions you want to aggregate. We're actively working on the Elicit API, so if th... (read more)

4Ethan Perez
Wow thanks for doing this! My takeaways: * Your "Ethan computed" distribution matches the intended/described distribution from my original prediction comment. The tail now looks uniform, while my distribution had an unintentional decay that came from me using Elicit's smoothing. * Now that I see how uniform looks visually/accurately, it does look slightly odd (without any decay towards zero), and a bit arbitrary that the uniform distribution ends at 2100. So I think it makes a lot of sense to use Datscilly's outside view as my outside view prior as you did! So overall, I think the ensembled distribution more accurately represents my beliefs, after updating on the other distributions in the LessWrong AGI timelines post. * The above ensemble distribution looks pretty optimistic, which makes me wonder if there is some "double counting" of scenarios-that-lead-to-AGI between the inside and outside view distributions. I.e., Datscilly's outside view arguably does incorporate the possibility that we get AGI via "Prosaic AGI" as I described it.

This links to a uniform distribution, guessing you didn't mean that! To link to your distribution, take a snapshot of your distribution, and then copy the snapshot url (which appears as a timestamp at the bottom of the page) and link that.

Daniel and SDM, what do you think of a bet with 78:22 odds (roughly 4:1) based on the differences in your distributions, i.e: If AGI happens before 2030, SDM owes Daniel $78. If AGI doesn't happen before 2030, Daniel owes SDM $22.

This was calculated by:

  1. Identifying the earliest possible date with substantial disagreement (in this case, 2030)
  2. Finding the probability each person assigns to the date range of now to 2030:
    1. Daniel: 39%
    2. SDM: 5%
  3. Finding a fair bet
    1. According to this post, a bet based on the arithmetic mean of 2 differing probability estimates yields the
... (read more)
2Sammy Martin
I'll take that bet! If I do lose, I'll be far too excited/terrified/dead to worry in any case.
4Daniel Kokotajlo
The main issue for me is that if I win this bet I either won't be around to collect on it, or I'll be around but have much less need for money. So for me the bet you propose is basically "61% chance I pay SDM $22 in 10 years, 39% chance I get nothing." Jonas Vollmer helped sponsor my other bet on this matter, to get around this problem. He agreed to give me a loan for my possible winnings up front, which I would pay back (with interest) in 2030, unless I win in which case the person I bet against would pay it. Meanwhile the person I bet against would get his winnings from me in 2030, with interest, assuming I lose. It's still not great because from my perspective it amounts to a loan with a higher interest rate basically, so it would be better for me to just take out a long-term loan. (The chance of never having to pay it back is nice, but I only never have to pay it back in worlds where I won't care about money anyway.) Still though it was better than nothing so I took it.

The blue distribution labeled "Your distribution" in this snapshot is Alex's updated 2020 prediction.

I can help with this if you share the post with me!

2Daniel Kokotajlo
Thanks so much!

Oh yeah that makes sense, I was slightly confused about the pod setup. The approach would've been different in that case (still would've estimated how many people in each pod were currently infected, but would've spent more time on the transmission rate for 30 feet outdoors). Curious what your current prediction for this is? (here is a blank distribution for the question if you want to use that)

3Raemon
I haven't yet attempted to seriously estimate it. I know of two other people who have risk calculators that I'm going to try to use at some point, and was interested in having a few different estimates to help triangulate things.

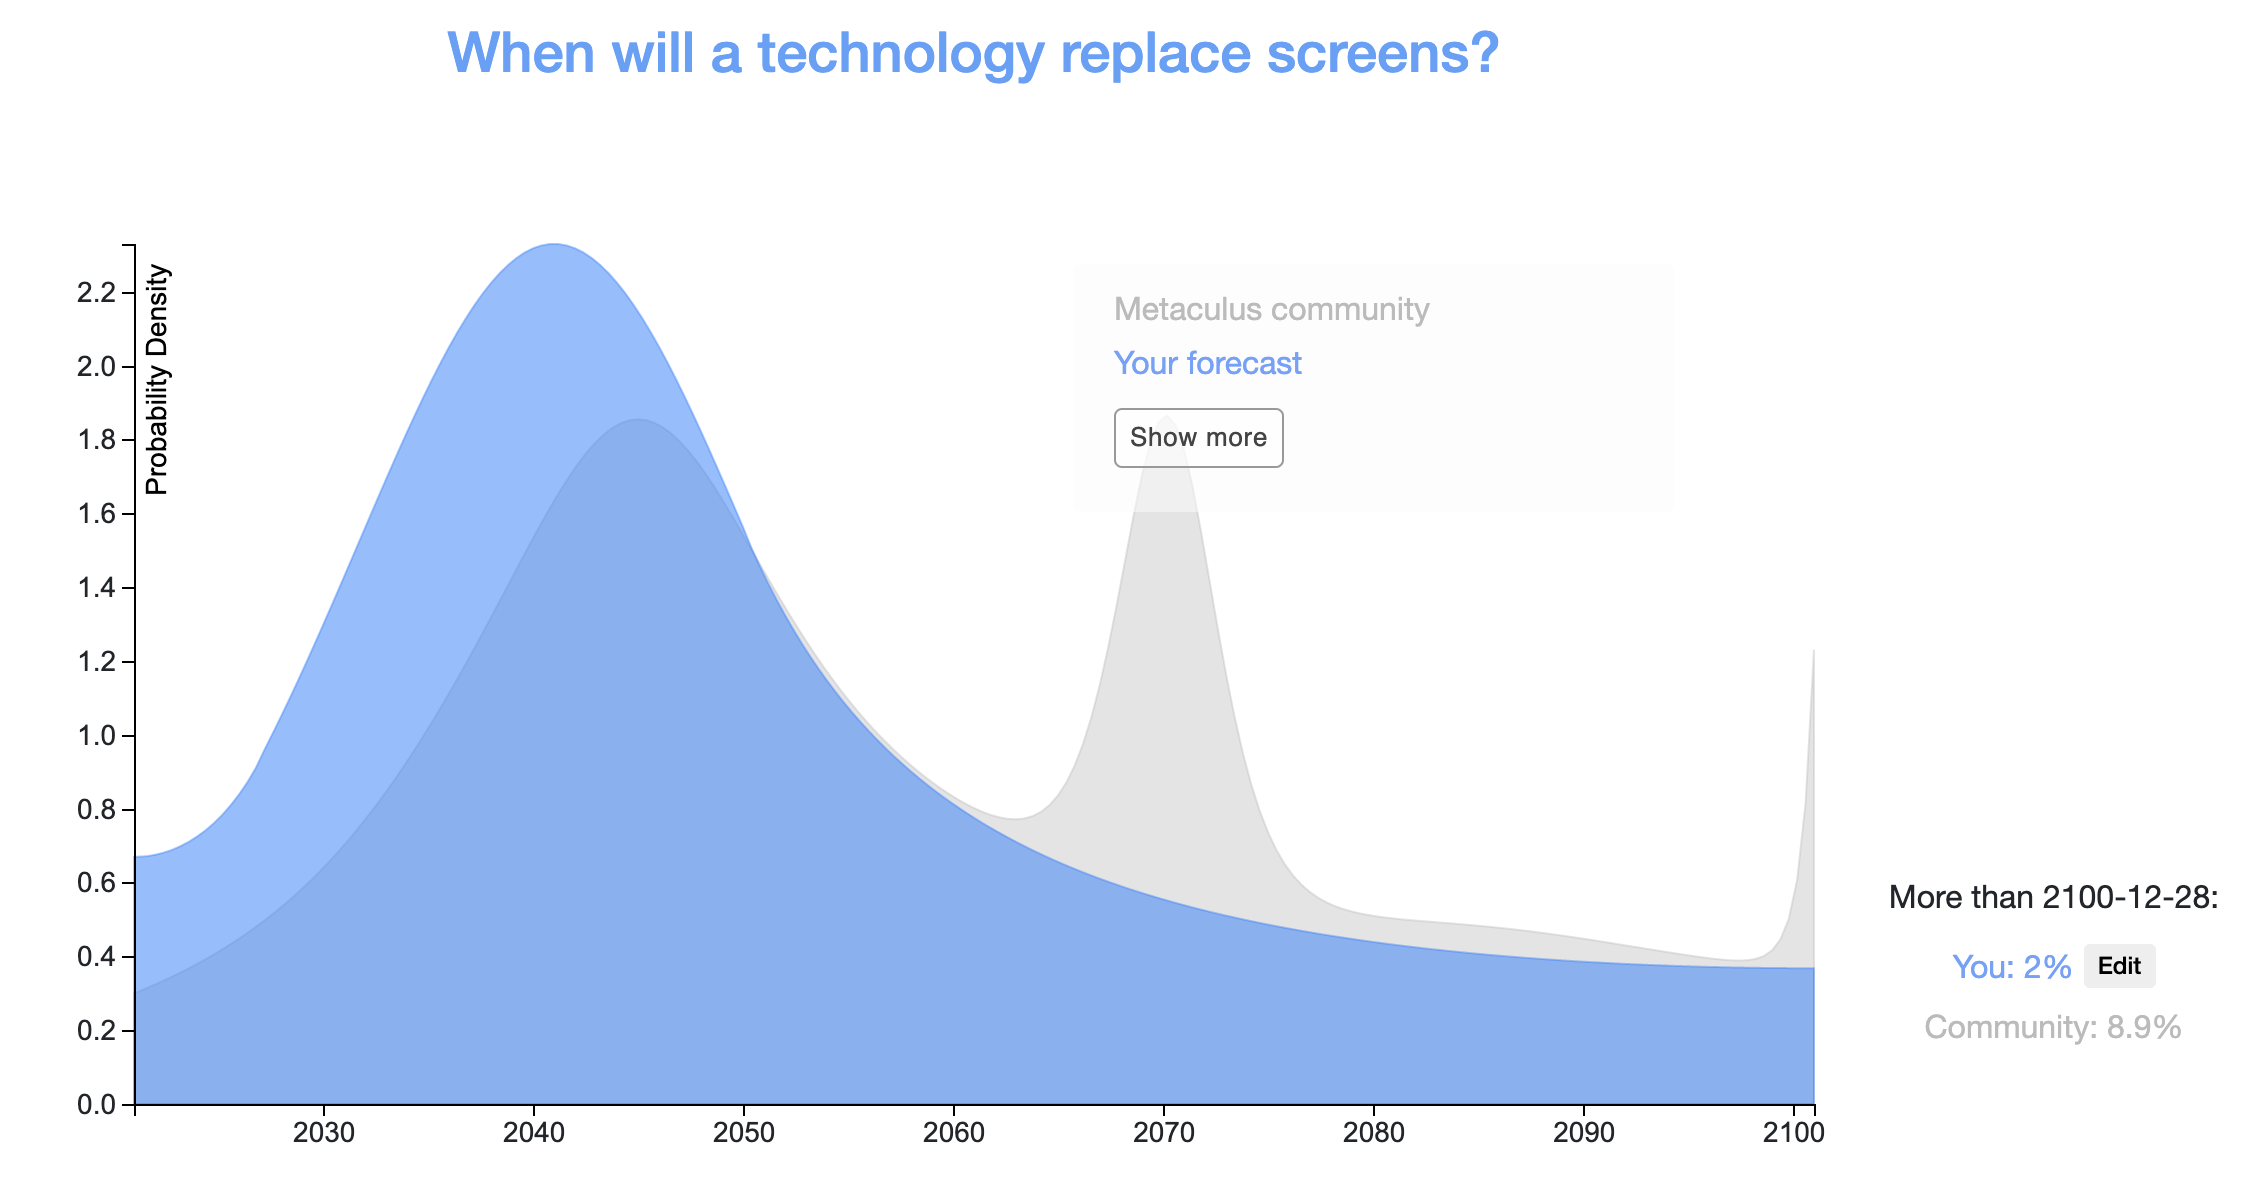
Here’s my prediction for this! I predicted a median of March 1, 2029. Below are some of the data sources that informed my thinking.

... (read more)

Here's my prediction, and here's a spreadsheet with more details (I predicted expected # of people who would get COVID). Some caveats/assumptions:

  • There's a lot of uncertainty in each of the variables that I didn't have time to research in-depth
  • I didn't adjust for this being outdoors, you can add a row and adjust for that if you have a good sense of how it would affect it.
  • I wasn't sure how to account for the time being 3 hours. My sense is that if you're singing loudly at people < 1m for 3 hours, this is going to be a
... (read more)
2Raemon
Thanks! (fwiw: I was assuming the people in pods would already have infected each other or would be about to infect each other anyways (due to sharing a house and lots of airspace), so the intent was something more about how much additional spread would be between pods, outdoors)

Either expected number of people who get covid or number of microcovids generated by the event works as a question! My instinctive sense is that # of people who get covid will be easier to quickly reason about, but I'll see as I'm forecasting it.

4Raemon
Nod. My guess is that that number of people in expectation will likely be 0 (if it turns out to be 1 or more than that's a dealbreaker for the event), and "fractional chance at least one person gets it" would be decision relevant for me. *I guess further consideration that's harder to reason about is "I'm expecting most of the attendees to be the sort of person who takes caution seriously most of the time, which lowers the rate of people who are likely to have in the first place to transmit it." But, not sure how to quantify that and don't really want to rely on it.

In a similar vein to this, I found several resources that make me think it should be higher than 1% currently and in the next 1.5 years:

  • This 2012/3 paper by Vincent Müller and Nick Bostrom surveyed AI experts, in particular, 72 people who attended AGI workshops (most of whom do technical work). Of these 72, 36% thought that assuming HLMI would at some point exist, it would be either ‘on balance bad’ or ‘extremely bad’ for humanity. Obviously this isn't an indication that they understand or agree with safety concerns,
... (read more)
2Rohin Shah
This is relevant, but I tend to think this sort of evidence isn't really getting at what I want. My main reaction is one that you already said: I think many people have a general prior of "we should be careful with wildly important technologies", and so will say things like "safety is important" and "AGI might be bad", without having much of an understanding of why. Also, I don't expect the specific populations surveyed in those two sources to overlap much with "top AI researchers" as defined in the question, though I have low confidence in that claim.

If people don't have a strong sense of who these people are/would be, you can look through this google scholar citation list (this is just the top AI researchers, not AGI researchers).

We're ok with people posting multiple snapshots, if you want to update it based on later comments! You can edit your comment with a new snapshot link, or add a new comment with the latest snapshot (we'll consider the latest one, or whichever one you identify as your final submission)

Would the latter distribution you described look something like this?

2Gurkenglas
Not quite. Just look at the prior and draw the vertical line at 2030. Note that you're incentivizing people to submit their guess as late as possible, both to have time to read other comments yourself and to put your guess right to one side of another.