All of Rareș Baron's Comments + Replies
Your hypothesis seems reasonable, and I think the following proves it.
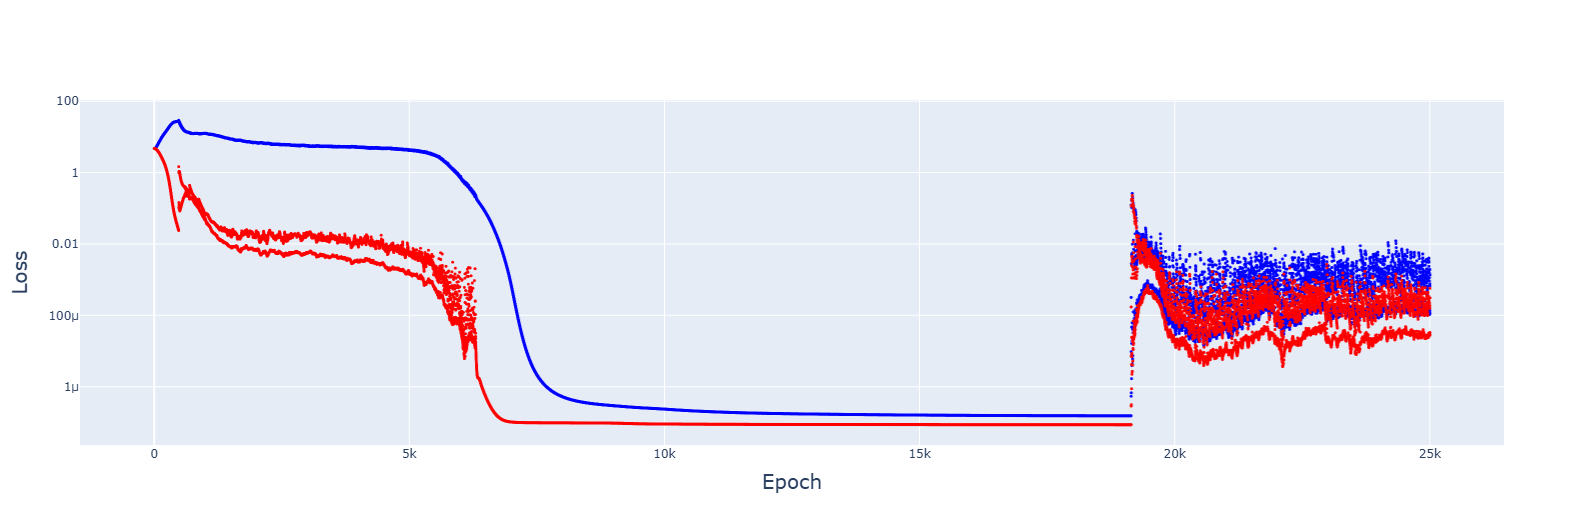
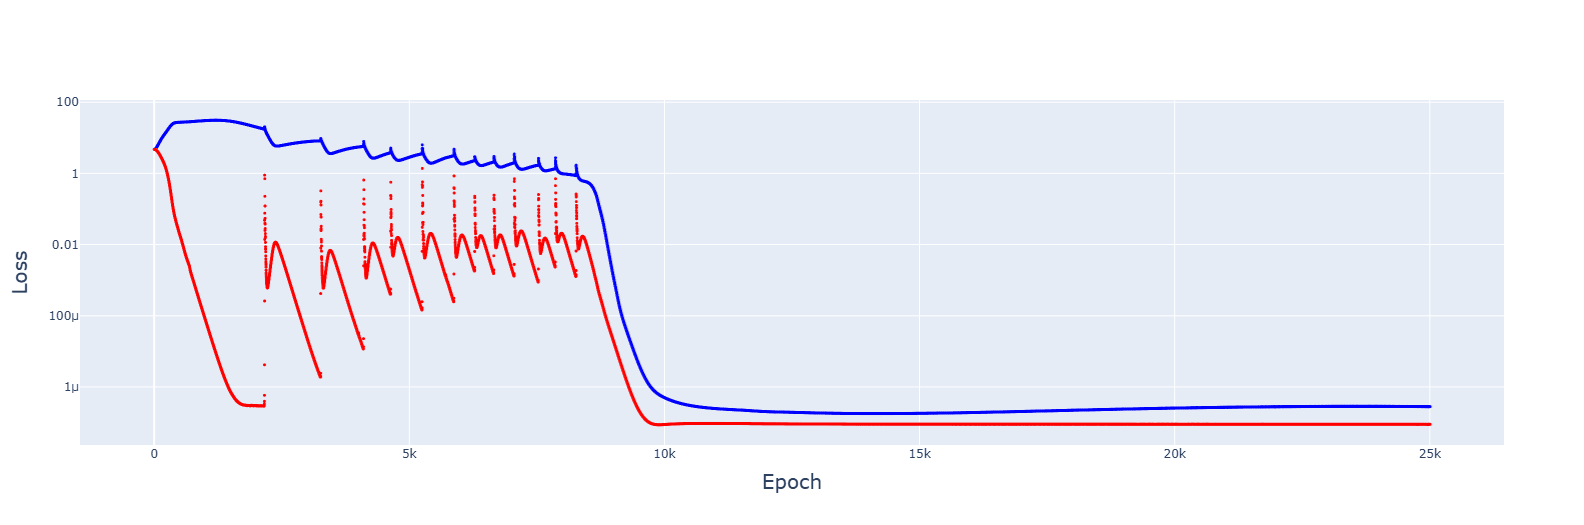
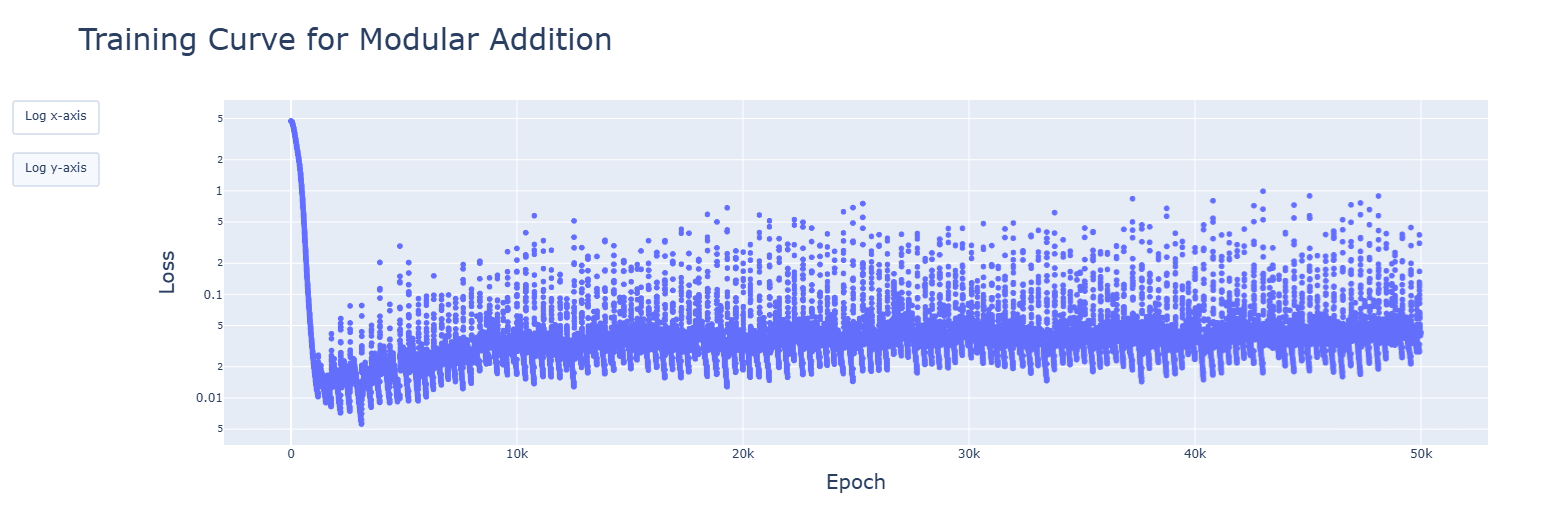
1. This is for 5e-3, giving no spikes and faster convergences:
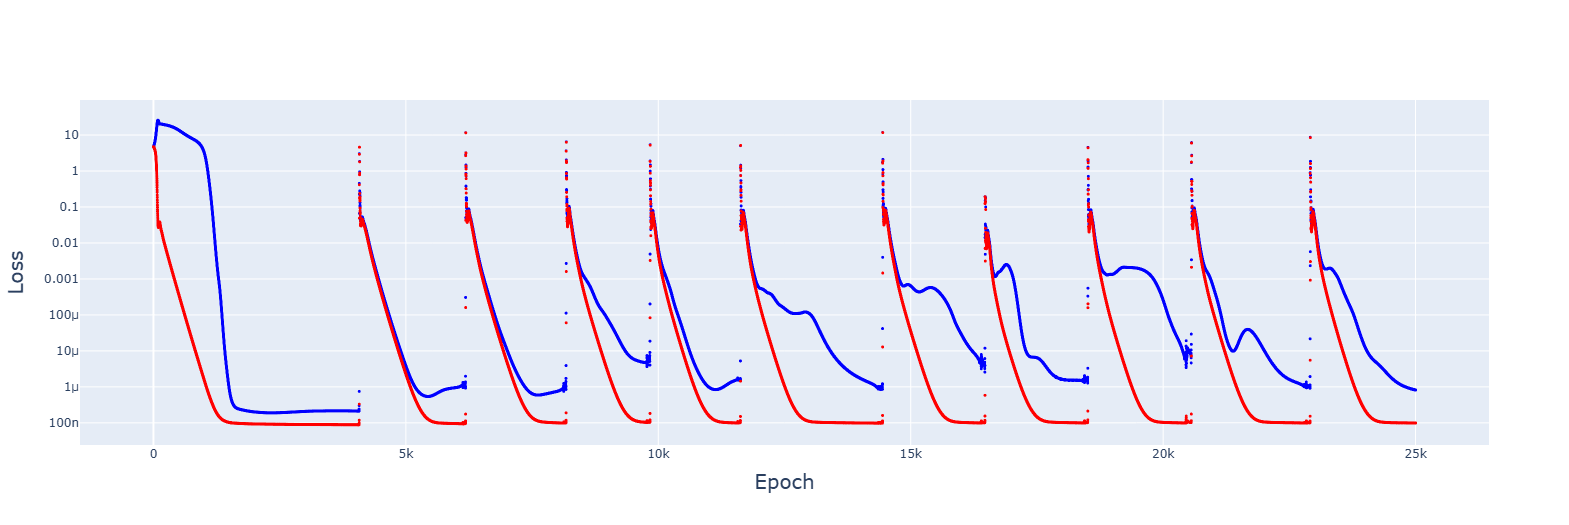
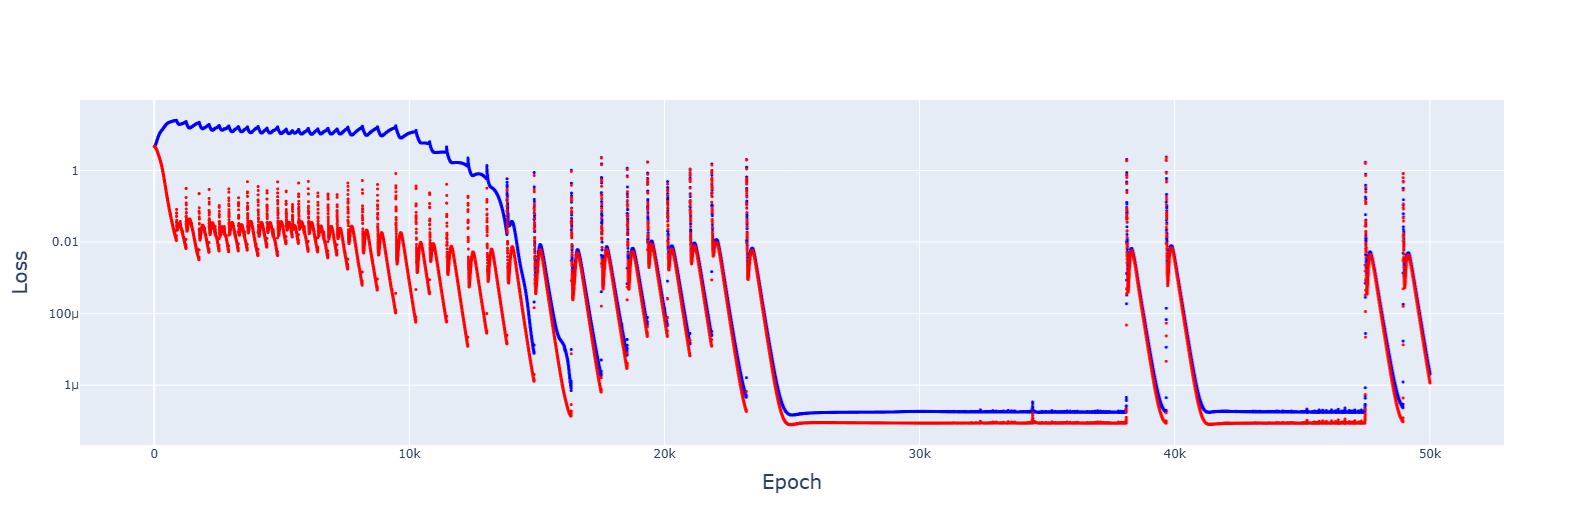
2. Gradient descent failed to converge for multiple LRs, from 1e-2 to 1e-5. However, decreasing the LR by 1.0001 when the training error increases gave this:
It's messy, and the decrease seems to turn the jumps of the slingshot effect into causes for getting stuck in sub-optimal basins, but the trajectory was always downwards. Increasing the rate of reduction decreased spikes but convergence no longer appeared.
An increase to 2....
I have uploaded html files of all the animation so they can be interactive. The corresponding training graphs are in the associated notebooks.
The original learning rate was 1e-3.
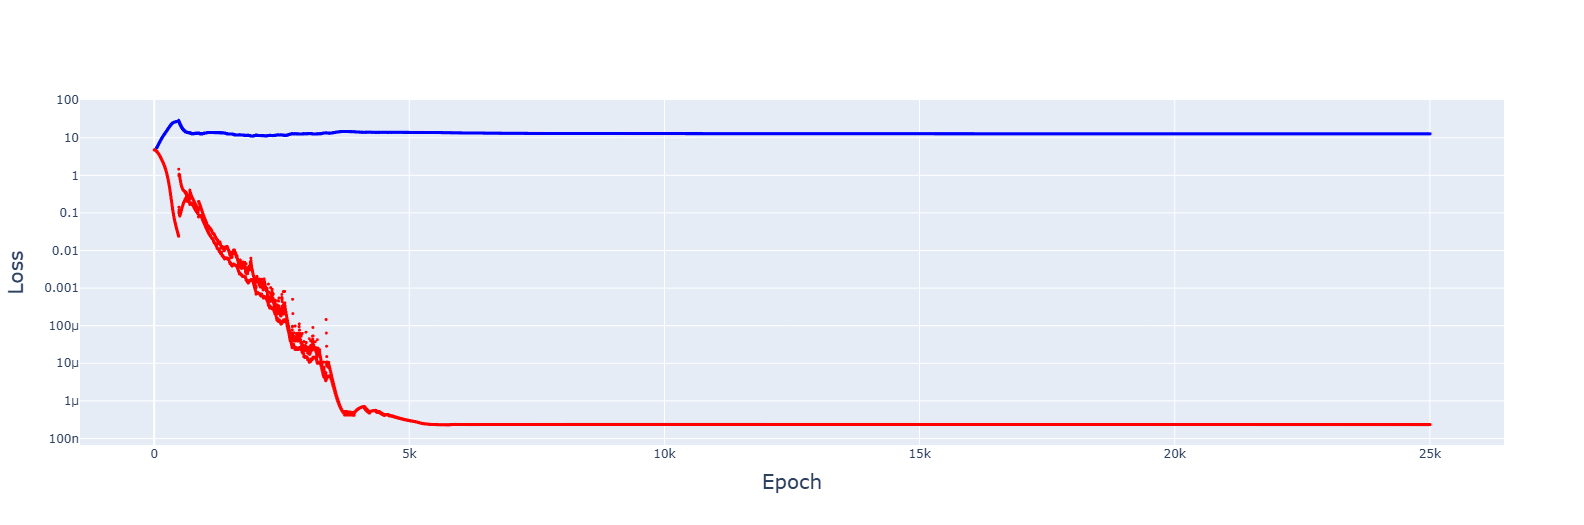
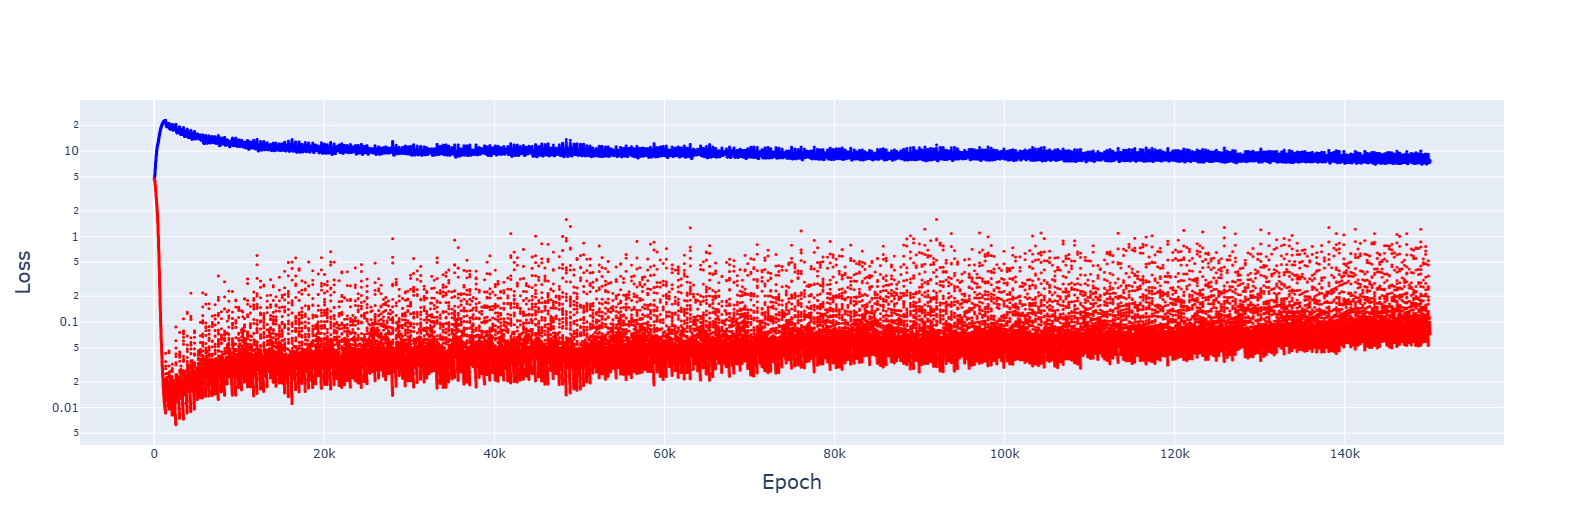
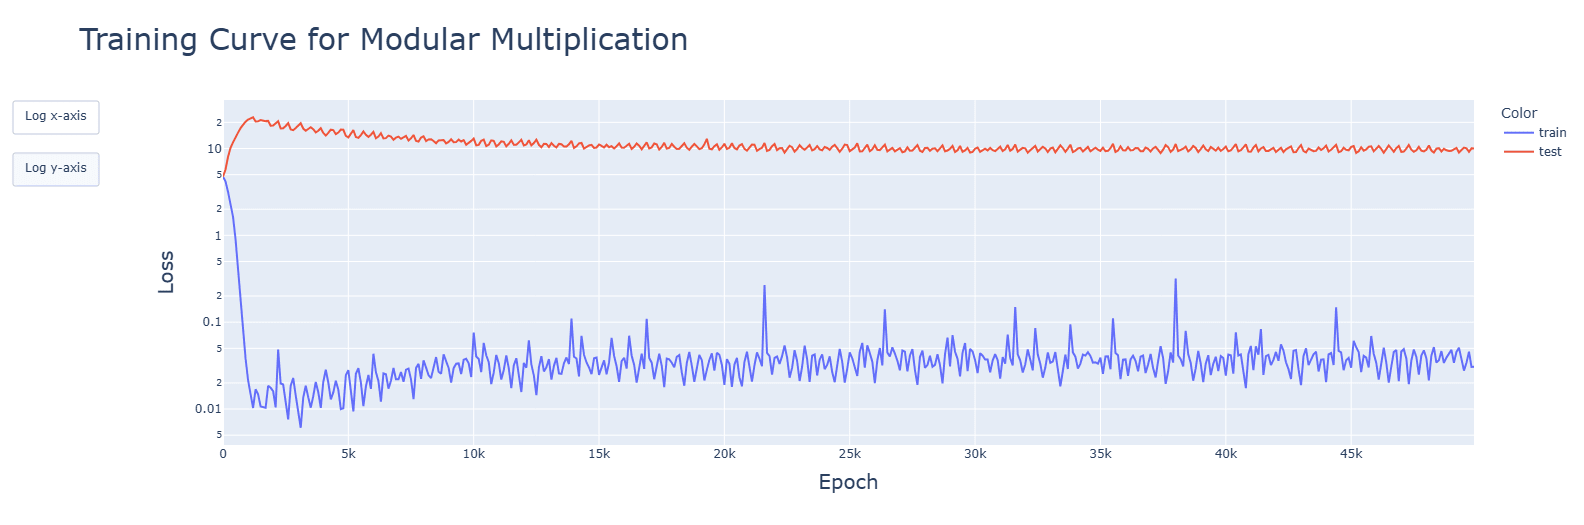
For 5e-4, it failed to converge:
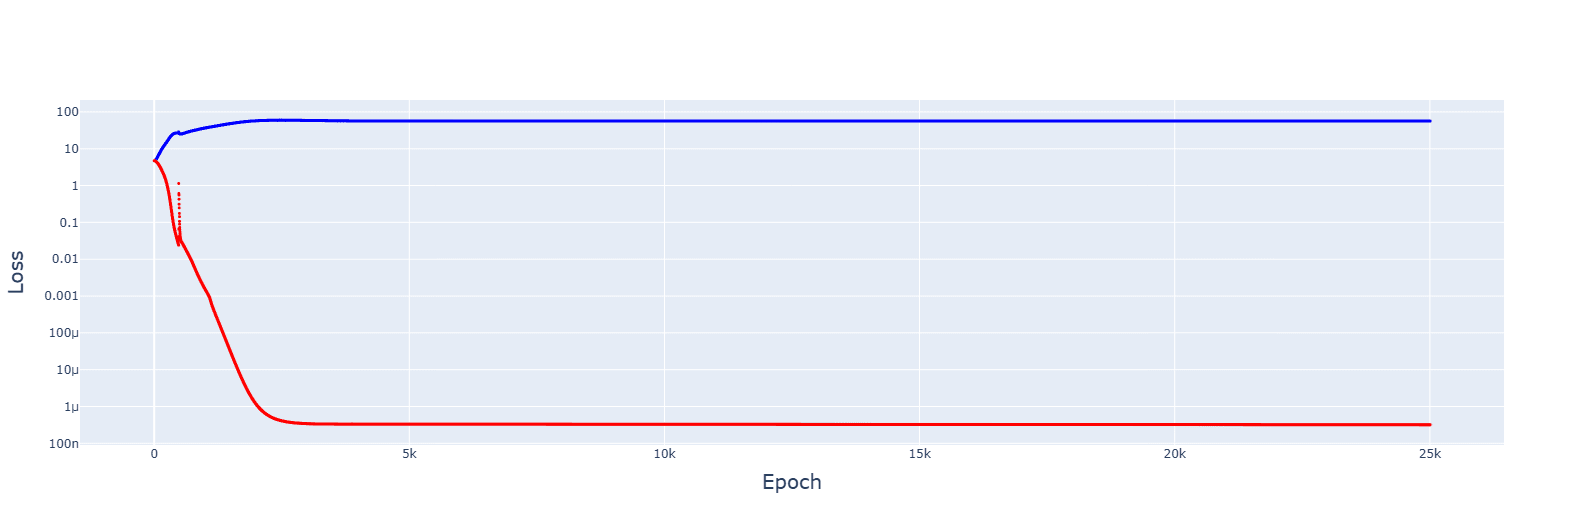
For 8e-4, it did converge, and the trajectory was downwards this time:

For 1 and 2 - I have. Everything is very consistent.
For 3, I have tried several optimizers, and they all failed to converge. Tweaking the original AdamW to reduce the learning rate lead to very similar results:
For 4, I have done animations for every model (besides the 2 GELU variants). I saw pretty much what I expected: a majority of relevant developments (fourier frequencies, concentration of singular values, activations and attention heads) happened quickly, in the clean-up phase. The spikes seen in SiLU and SoLU_LN were visible, though not lasting. I ha...
Fair statistical point, however in reality a vast majority of serial killers did not go above 15 victims, and the crimes they commited were perpretated before their first (and last) arrest. I do not have raw numbers, but my impression is that the number of those sentenced for one murder, later paroled, and then beginning their spree of more than 3-4, is incredibly small. Serial killers are also rare in general.
Gang considerations, however, might be a larger factor here, though I still doubt it is enough to tip the scales (especially as prison gang affiliat...
I am sorry for being slow to understand. I hope I will internalise your advice and the linked post quickly.
I have re-done the graphs, to be for every epoch. Very large spikes for SiLU were hidden by the skipping. I have edited the post to rectify this, with additional discussion.
Again, thank you (especially your patience).
Apologies for misunderstanding. I get it now, and will be more careful from now on.
I have re-run the graphs where such misunderstandings might appear (for this and a future post), and added them here. I don't think I have made any mistakes in interpreting the data, but I am glad to have looked at the clearer graphs.
Thank you very much!
I will keep that in mind for the future. Thank you!
I have put all high-quality .pngs of the plots in the linked Drive folder.
I have major disagreements with the arguments of this post (with the understanding that it is a steelman), but I do want to say that it has made me moderately update towards the suitability of the death penalty as a punishment, from a purely utilitarian perspective (though it has not tipped the scale). It has also showcased interesting and important figures, so thank you for that.
Deterrence and recidivism
At that point killing 3 million criminals to save the lives of 2.4 million
How many of those 2.4 million were murdered by recidivists? Even if we assume th...
Your hypothesis seems reasonable, and I think the following proves it.![]()
![]()
1. This is for 5e-3, giving no spikes and faster convergences:
2. Gradient descent failed to converge for multiple LRs, from 1e-2 to 1e-5. However, decreasing the LR by 1.0001 when the training error increases gave this:
It's messy, and the decrease seems to turn the jumps of the slingshot effect into causes for getting stuck in sub-optimal basins, but the trajectory was always downwards. Increasing the rate of reduction decreased spikes but convergence no longer appeared.
An increase to 2.... (read more)