
Hi all, I've been working on some AI forecasting research and have prepared a draft report on timelines to transformative AI. I would love feedback from this community, so I've made the report viewable in a Google Drive folder here.
With that said, most of my focus so far has been on the high-level structure of the framework, so the particular quantitative estimates are very much in flux and many input parameters aren't pinned down well -- I wrote the bulk of this report before July and have received feedback since then that I haven't fully incorporated yet. I'd prefer if people didn't share it widely in a low-bandwidth way (e.g., just posting key graphics on Facebook or Twitter) since the conclusions don't reflect Open Phil's "institutional view" yet, and there may well be some errors in the report.
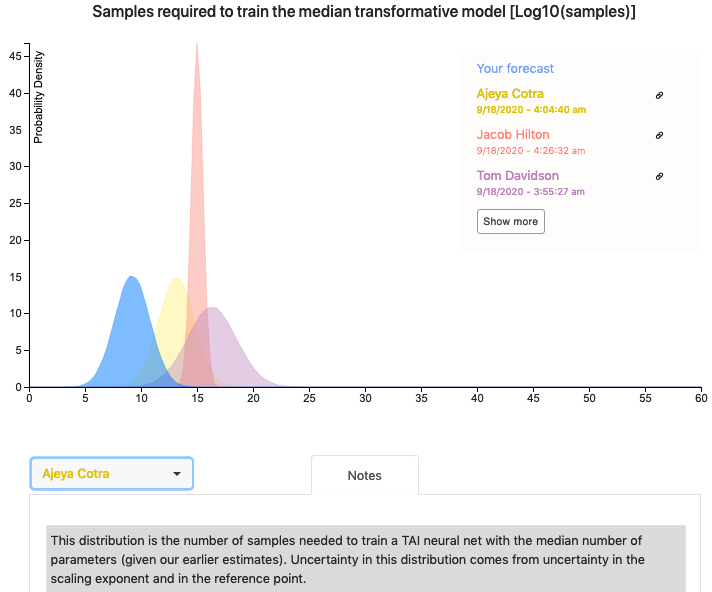
The report includes a quantitative model written in Python. Ought has worked with me to integrate their forecasting platform Elicit into the model so that you can see other people's forecasts for various parameters. If you have questions or feedback about the Elicit integration, feel free to reach out to elicit@ought.org.
Looking forward to hearing people's thoughts!
I saw a presentation covering a bunch of this back in February, and the graphs I found most informative were those showing the training flop distributions before updating against already-achievable levels. There is one graph along these lines on page 13 in part 1 in the google docs, but it doesn't show the combined distribution without the update against already achievable flops.
Am I correct in remembering that the combined distribution before that update was distinctly bimodal? That was one of my main takeaways from the presentation, and I want to make sure I'm remembering it correctly.
Thanks, that makes sense.