Continued from part 1.
The gist of part 2 is four graphs.
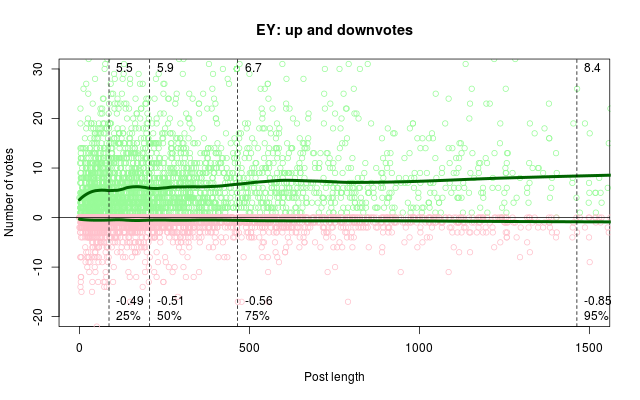
The graphs plot most of the data (except for outliers) in the following form. Each post is represented by two points with the same X coordinate: the number of characters. The Y coordinate for one point is the number of upvotes the post received, the Y coordinate of the other point is the number of downvotes for the same post. Upvotes are light green and downvotes are pink.
The upvotes and the downvotes are modeled separately by two loess (local regression) curves. The difference between two graphs for each of the posters is in the details of the fit. Specifically, one fit assumes gaussian errors and so the loess curve tends to approximate the local mean. The other fit assumes heavy-tailed errors and its loess curve tends to approximate the local median. Since the distribution of votes is skewed, the mean and the median are noticeably different.
Each plot has four vertical lines at four quantiles: 25%, 50%, 75%, and 95%. The lower numbers represent the loess estimate of the number of downvotes for this particular post length. The upper numbers represent the loess estimate of the number of upvotes.
We will start with the robust fit which approximates the median. Here is the plot for EY
and here is the plot for SA
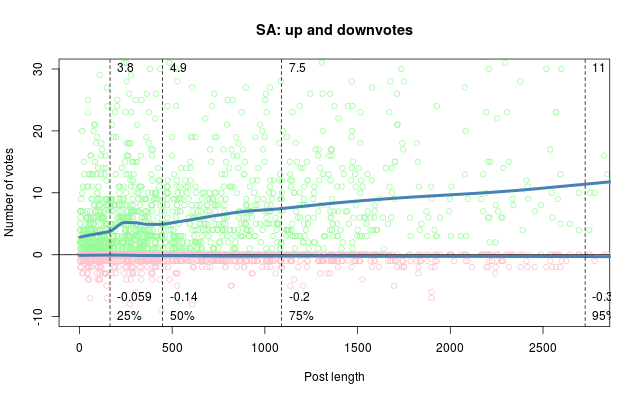
As you can see, longer posts pay off though not in a particularly spectacular manner for EY -- long posts work better for SA. The downvotes also increase, but insignificantly. If we treat the loess estimate as the median, in all cases half of the posts has zero downvotes.
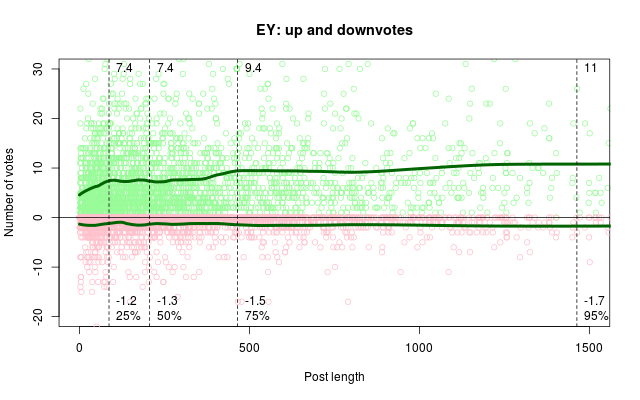
Since the votes are positively skewed, the means should be higher than the medians and we can see it in the second set of graphs with non-robust loess fits. EY
and SA
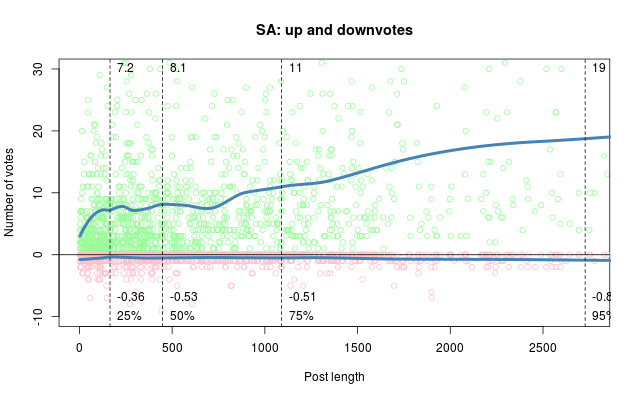
The overall pattern is very much the same, but the numbers are higher. Again, longer posts bring much more karma for SA, not so much but still some for EY.
A few months ago we have launched an experimental website. In brief, our goal is to create a platform where unrestricted freedom of speech would be combined with high quality of discussion. The problem can be approached from two directions. One is to help users navigate through content and quickly locate the higher quality posts. Another, which is the topic of this article, is to help users improve the quality of their own posts by providing them with meaningful feedback.
One important consideration for those who want to write better comments is how much detail to leave out. Our statistical analysis shows that for many users there is a strong connection between the ratings and the size of their comments. For example, for Yvain (Scott Alexander) and Eliezer_Yudkowsky, the average number of upvotes grows almost linearly with increasing comment length.
This trend, however, does not apply to all posters. For example, for the group of top ten contributors (in the last 30 days) to LessWrong, the average number of upvotes increases only slightly with the length of the comment (see the graph below). For quite a few people the change even goes in the opposite direction – longer comments lead to lower ratings.
Naturally, even if your longer comments are rated higher than the short ones, this does not mean that inflating comments would always produce positive results. For most users (including popular writers, such as Yvain and Eliezer), the average number of downvotes increases with increasing comment length. The data also shows that long comments that get most upvotes are generally distinct from long comments that get most downvotes. In other words, long comments are fine as long as they are interesting, but they are penalized more when they are not.
The rating patterns vary significantly from person to person. For some posters, the average number of upvotes remains flat until the comment length reaches some threshold and then starts declining with increasing comment length. For others, the optimal comment length may be somewhere in the middle. (Users who have accounts on both Lesswrong and Omnilibrium can check the optimal length for their own comments on both websites by using this link.)
Obviously length is just one among many factors that affect comment quality and for most users it does not explain more than 20% of variation in their ratings. We have a few other ideas on how to provide people with meaningful feedback on both the style and the content of their posts. But before implementing them, we would like to get your opinions first. Would such feedback be actually useful to you?