LGS
559
Ω
13
145
LGS has not written any posts yet.

LGS has not written any posts yet.
Exactly
The universe doesn't care if you try to hide your oh so secret insights; multiple frontier labs are working on those insights
The only people who care are the people here getting more doomy and having worse norms for conversations.
I don't appreciate the local discourse norm of "let's not mention the scary ideas but rest assured they're very very scary". It's not healthy. If you explained the idea, we could shoot it down! But if it's scary and hidden then we can't.
Also, multiple frontier labs are currently working on it and you think your lesswrong comment is going to make a difference?
You should at least say by when you will consider this specific single breakthrough thing to be falsified.
You should show your calculation or your code, including all the data and parameter choices. Otherwise I can't evaluate this.
I assume you're picking parameters to exaggerate the effects, because just from the exaggerations you've already conceded (0.9/0.6 shouldn't be squared and attenuation to get direct effects should be 0.824), you've already exaggerated the results by a factor of sqrt(0.9/0.6)/0.824 for editing, which is around a 50% overestimate.
I don't think that was deliberate on your part, but I think wishful thinking and the desire to paint a compelling story (and get funding) is causing you to be biased in what you adjust for and in which mistakes you catch. It's natural in your position to scrutinize low estimates but not high ones. So to trust your numbers I'd need to understand how you got them.
I don't understand. Can you explain how you're inferring the SNP effect sizes?
I'm talking about this graph:
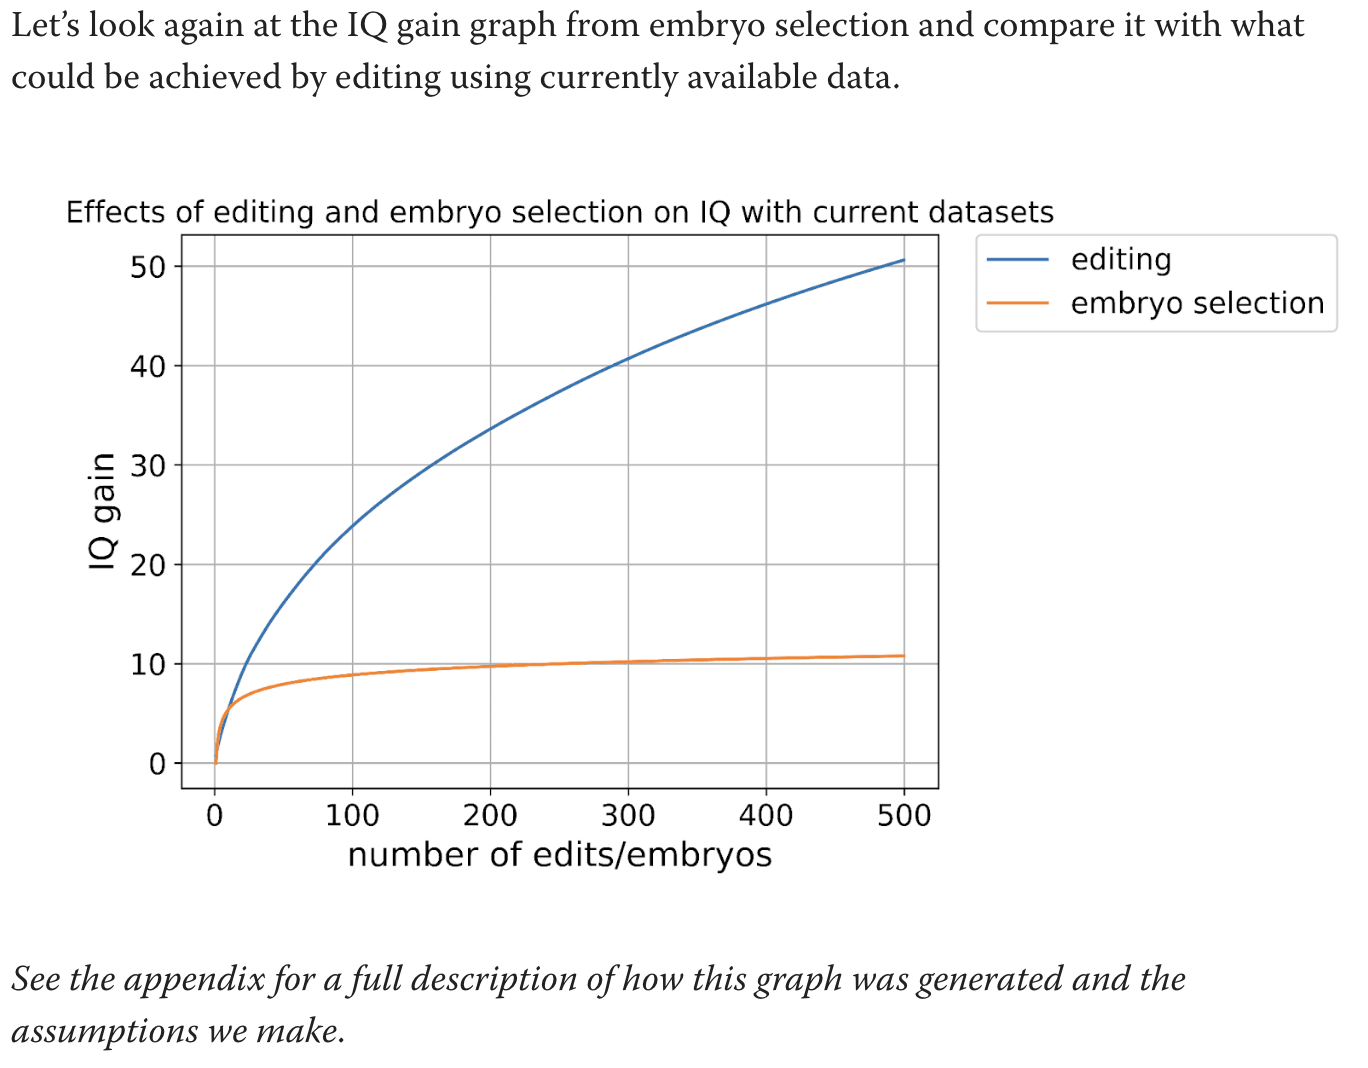
What are the calculations used for this graph. Text says to see the appendix but the appendix does not actually explain how you got this graph.
You're mixing up h^2 estimates with predictor R^2 performance. It's possible to get an estimate of h^2 with much less statistical power than it takes to build a predictor that good.
Thanks. I understand now. But isn't the R^2 the relevant measure? You don't know which genes to edit to get the h^2 number (nor do you know what to select on). You're doing the calculation 0.2*(0.9/0.6)^2 when the relevant calculation is something like 0.05*(0.9/0.6). Off by a factor of 6 for the power of selection, or sqrt(6)=2.45 for the power of editing
The paper you called largest ever GWAS gave a direct h^2 estimate of 0.05 for cognitive performance. How are these papers getting 0.2? I don't understand what they're doing. Some type of meta analysis?
The test-retest reliability you linked has different reliabilities for different subtests. The correct adjustment depends on which subtests are being used. If cognitive performance is some kind of sumscore of the subtests, its reliability would be higher than for the individual subtests.
Also, I don't think the calculation 0.2*(0.9/0.6)^2 is the correct adjustment. A test-retest correlation is already essentially the square of a correlation of the test with an underlying latent factor (both the test AND the retest have error).... (read more)
Thanks! I understand their numbers a bit better, then. Still, direct effects of cognitive performance explain 5% of variance. Can't multiply the variance explained of EA by the attenuation of cognitive performance!
Do you have evidence for direct effects of either one of them being higher than 5% of variance?
I don't quite understand your numbers in the OP but it feels like you're inflating them substantially. Is the full calculation somewhere?
You should decide whether you're using a GWAS on cognitive performance or on educational attainment (EA). This paper you linked is using a GWAS for EA, and finding that very little of the predictive power was direct effects. Exactly the opposite of your claim:
For predicting EA, the ratio of direct to population effect estimates is 0.556 (s.e. = 0.020), implying that 100% × 0.5562 = 30.9% of the PGI’s R2 is due to its direct effect.
Then they compare this to cognitive performance. For cognitive performance, the ratio was better, but it's not 0.824, it's . But actually, even this is possibly too high: the table in figure 4 has a ratio that looks... (read more)
Exactly! The frontier labs have the compute and incentive to push capabilities forward, while randos on lesswrong are instead more likely to study alignment in weak open source models