This is a linkpost for https://docs.google.com/document/d/1cIHfQcRIV_wNF6IlqIoqY83NRDl4US012v1PtsTPo4s/edit
New Comment
Great post, especially the companion piece :)
I'm tangentially reminded of professional modeler & health economist froolow's refactoring of GiveWell's cost-effectiveness models in his A critical review of GiveWell's 2022 cost-effectiveness model (sections 3 and 4), which I think of as complementary to your post in that it teaches-via-case-study how to level up your spreadsheet modeling.
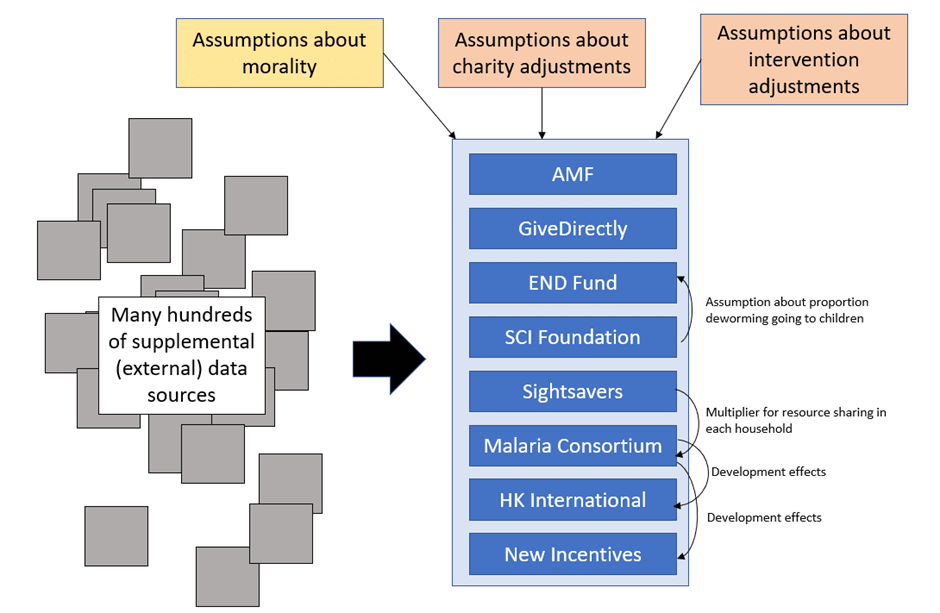
Here's GiveWell's model architecture:
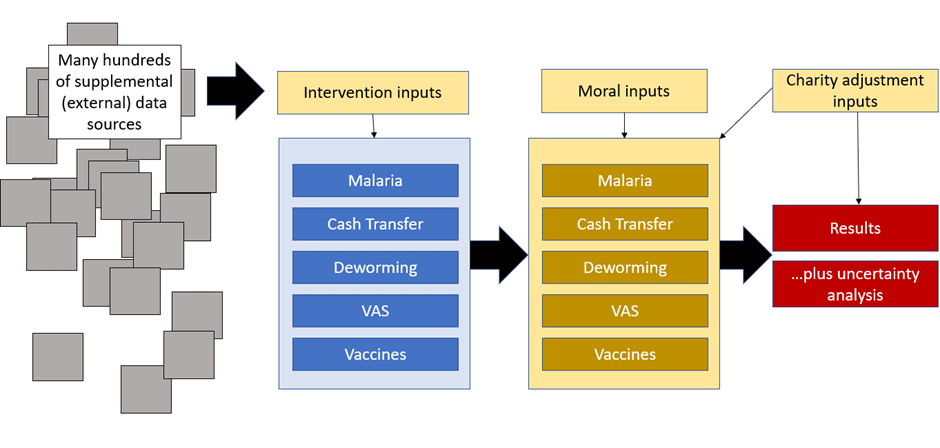
And here's froolow's refactoring:
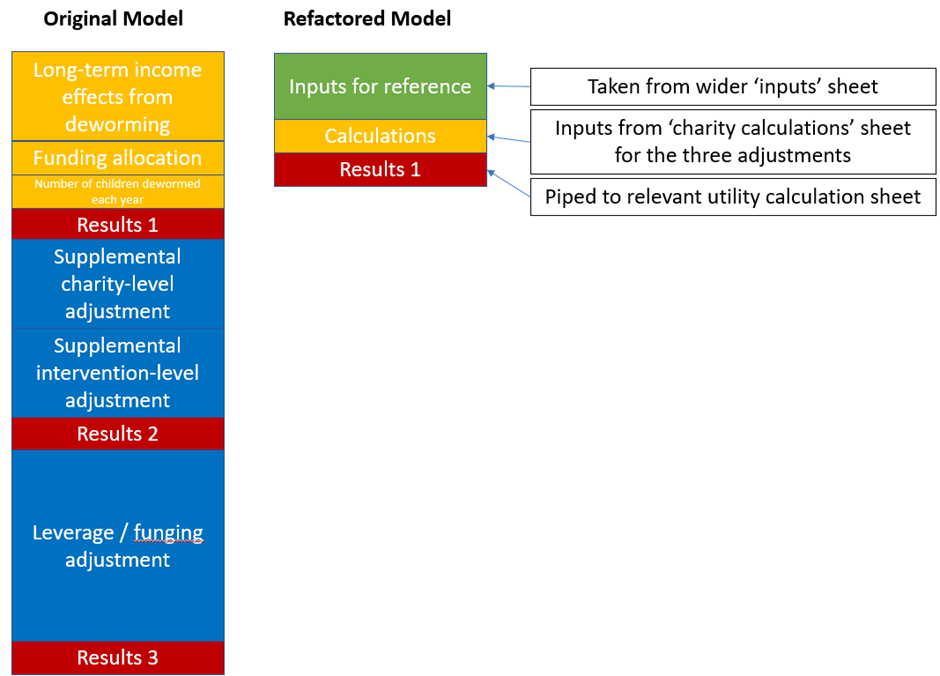
The difference in micro-level architecture is also quite large:
As someone who's spent a lot of his (short) career building dashboards and models in Google Sheets, and having seen GiveWell's CEAs, I empathized with froolow's remarks here:
After the issue of uncertainty analysis, I’d say the model architecture is the second biggest issue I have with the GiveWell model, and really the closest thing to a genuine ‘error’ rather than a conceptual step which could be improved. Model architecture is how different elements of your model interact with each other, and how they are laid out to a user.
It is fairly clear that the GiveWell team are not professional modellers, in the same way it would be obvious to a professional programmer that I am not a coder (this will be obvious as soon as you check the code in my Refactored model!). That is to say, there’s a lot of wasted effort in the GiveWell model which is typical when intelligent people are concentrating on making something functional rather than using slick technique. A very common manifestation of the ‘intelligent people thinking very hard about things’ school of model design is extremely cramped and confusing model architecture. This is because you have to be a straight up genius to try and design a model as complex as the GiveWell model without using modern model planning methods, and people at that level of genius don’t need crutches the rest of us rely on like clear and straightforward model layout. However, bad architecture is technical debt that you are eventually going to have to service on your model; when you hand it over to a new member of staff it takes longer to get that member of staff up to speed and increases the probability of someone making an error when they update the model.
Thanks, I found this interesting! I remember reading that piece by Froolow but I didn't realize the refactoring was such a big part of it (and that the GiveWell CEA was formatted in such a dense way, wow).
This resonates a lot with my experience auditing sprawling, messy Excel models back in my last job (my god are there so many shitty Excel models in the world writ large).
FWIW if I were building a model this complex, I'd personally pop it into Squiggle / Squigglehub — if only because at that point, properly multiplying probabilities together and keeping track of my confidence interval starts to really matter to me :)
Do you have any thoughts on why hierarchical spreadsheets like TreeSheets never became popular?
So after tearing my hair out trying to generate increasingly complex statistical analyses of scientific data in Excel, my world changed completely when I started using KNIME to process and transform data tables. It is perfect for a non-programmer such as myself, allowing the creation of complex yet easily broken-down workflows, that use spreadsheet input and output. Specialist domain tools are easily accessible (e.g chemical structure handling and access to the RDKit toolkit for my own speciality) and there is a thriving community generating free-to-use functionality. Best of all it is free to the single desk-top user.
Know some fancier formulas like left/mid/right, concatenate, hyperlink
Wait, I thought basic fancier formulas are like =index(.., match(.., .., 0))
I guess https://dev.to/aprillion/self-join-in-sheets-sql-python-and-javascript-2km4 might be a nice toy example if someone wants to practice the lessons from the companion piece 😹
Thank you for this! Your companion piece instantly solved a problem I was having with my diet spreadsheet!
I'm surprised to see no mention of the LET function for making formulas more readable.
Another glaring omission is Power Query in Excel. I find it incredibly useful for connecting to data sources and transforming data. It's easily auditable as it produces steps of code for table transformations rather than working with thousands of cells with individual formulas.
When it comes to writing about spreadsheets, it's just about impossible to even skim the surface without missing anything, especially considering many aspects like array formulas, VBA macros, pivot tables with DAX measures, and Power Query can go super deep. I own a 758-page textbook just on Power Query and multiple books on Power Pivot / DAX.
They're mentioned in the companion piece (Google Docs) linked at the bottom of this post. This isn't the full post.
Ah, I do see the LET function now but I still can't find a reference to the Power Query editor.
Epistemic status: Passion project / domain I’m pretty opinionated about, just for fun.
In this post, I walk through some principles I think good spreadsheets abide by, and then in the companion piece, I walk through a whole bunch of tricks I've found valuable.
Who am I?
I’ve spent a big chunk of my (short) professional career so far getting good at Excel and Google Sheets.[1] As such, I’ve accumulated a bunch of opinions on this topic.
Who should read this?
This is not a guide to learning how to start using spreadsheets at all. I think you will get more out of this post if you use spreadsheets at least somewhat frequently, e.g.
Principles of good spreadsheets
Broadly speaking, I think good spreadsheets follow some core principles (non-exhaustive list).
I think the below is a combination of good data visualization (or just communication) advice, systems design, and programming design (spreadsheets combine the code and the output).
It should be easy for you to extract insights from your data
Your spreadsheet should be beautiful and easy to read
There should be one source of truth for your data
Your spreadsheet should be easy to audit
Your spreadsheet should be hard to break
Much more in the companion piece!
I’m using the term ‘Google Sheets’ in this doc, but almost all of the tricks mentioned here work for Excel as well.
My favorite Excel bug story: I used to work in litigation consulting, where I’d sometimes audit spreadsheets sent to us from the opposing side of a legal case.
In one case, an expert witness for the opposing side sent over a spreadsheet with columns similar to the following: year, online sales, in-person sales, total sales. The expert was saying that total sales had almost doubled from ~3,000 → ~5,000 for this particular product in 2019.
We eventually discovered that for the 2019 row, the expert had entered the formula =sum(A4:C4) instead of sum(B4:C4), and so had accidentally added the value ‘2019’ to the total sum. Here’s a recreation. (I’ve obfuscated the details a bit here but the core mistake was the same.)
As an aside, spreadsheets have a lot of use cases, which makes giving generalizable advice a bit trickier. For instance, some common use cases for spreadsheets:
- A database which you query whenever needed;
- A data visualization tool meant to present some interesting findings from existing data;
- A management tracker that you use to schedule emails and keep tabs on your tasks;
- To model some interesting phenomenon and keep track of your assumptions
Depending on what you’re using a spreadsheet for, you might prioritize some of these principles more or less highly. For instance, making something easy to read is probably more valuable when you’re creating a data visualization versus a database.
Of course, lots of spreadsheets combine lots of different use cases — e.g. you might have one tab with your source of truth data, and another for random analytics.