Anthropic's IPO roadshow video has a graph. It shows four models; I think dot 1 = Claude 3.5, dot 2 = Claude 4, dot 3 = Mythos, arrowhead = unreleased model.
The graph provided doesn't have any numbers on the Y axis. In this post I'll explain why I think the Y axis lines most likely represent a 10x jump each, and so the point at the end of the graph represents about a 30000x CM (i.e. Anthropic can currently pretrain models at the same quality with 1/30000th of the compute it needed in 2024). I'm pretty unsure about this though and it could plausibly be much higher or much lower. Keep in mind that this graph is only about pretraining and doesn't say anything about post-training.[1]
Without extra context, it's hard to say how much the compute has actually been multiplied: if each Y gridline is 1.1x the total multiplier would be about 1.53x; if each Y gridline is 10x the total multiplier would be about 30000x. (It's not clear to me why the last point is an arrowhead instead of a dot - maybe it's supposed to be their guess of what the compute multiplier will end up at for their latest pretraining run?)
What people in the IPO roadshow video say about compute multipliers
Sam McCandlish said (while that graph was displayed):
It’s how we serve models to customers and how we use Claude at scale internally. By training what we believe to be the most efficient models, we can do more of all these things with the same amount of compute. It’s also how we drive down costs, both for customers as well as our own underlying costs. We’re accelerating these efficiency gains through our research process. Our pace of discovery is speeding up, and a lot of that acceleration comes from Claude itself.
Tom Brown said:
The second driver of our compute advantage is our rate of discovery of compute multipliers. We focus on total effective compute, which is the multiplicative product of physical capacity times the compute multipliers that we discover.
Each one we discover makes our pool of total effective compute bigger. For example, say you need 100 units of compute to train a model of a certain intelligence. A 4X compute multiplier means you can use 25 units of compute to train the exact same model, or you can use those 100 physical units to train an even more intelligent model that would’ve previously required 400 units.
Compute multipliers create a competitive advantage for us that’s hard to replicate: they build on each other. Each new multiplier we discover has a positive effect on the multipliers before it. They stack.
We believe that this can accelerate even further as we approach recursive self-improvement. Claude will be able to discover compute multipliers entirely by itself, allowing the number of compute multipliers to grow faster and faster. We believe this combination of smart investments, breakthrough research, and the improving capabilities of Claude have put Anthropic in a leading position among the frontier labs.
Krishna Rao (CFO) said:
As Tom described, there are two drivers of this efficiency.
[...] The second is compounding compute multipliers, which have scaled our total effective compute significantly faster than our physical capacity. You can see this in our financial results. Over the last six quarters, we grew revenue by more than 45X, while compute and infrastructure costs grew only 10X. A more than 4X improvement in revenue per dollar of compute.
What is a CM?
From a deposition, a pretraining researcher explains what CMs are a bit better than the roadshow video:
Q. What do you mean by "makes the model dumber"?
A. Um, so the way that we normally define this is we -- because there's a notion of the compute efficient frontier. We're given a fixed budget of compute. There's an optimal way to train your model and an optimal loss you'll achieve on your objective function.
Um, so we can use this as a measuring stick comparing various models. So, for example, um, if you made the model much dumber, it might shift it down so as if you only had half as much compute to train that model.
Working backwards to estimate the actual compute multipliers
If we can estimate the CM from Claude 3.5 to Claude 4, we can work out where the rest of the points on the graph should be based on that. Here I try to estimate that number very roughly.
Model codename reference
We know the codenames from this filing, and some of the compute numbers from this graph.
I believe lark is approximately finch but without training data from LibGen or PiLiMi, which hurt performance. I believe tern (Claude 2) was likely the same architecture as lark, and possibly continued pretraining on lark. Teal was almost certainly a fresh pretrain and a new architecture.[3]
This graph[4] from an internal presentation shows that the actual amount of compute used to train Claude 1.0 was about 1.6e25 FLOPs. Extrapolating that graph to when Opus 3 pretraining finished would give 7.4e25 FLOPs. For various kinda complicated reasons[5] I think this is too high and it's actually more like ~4e25 FLOPs. So Opus 3 had ~2.5x the pretraining compute as Claude 1.0.
To calculate the 1.0 -> Opus 3 CM correctly we'd have to know how good 1.0 would be if we scaled it up to use as many FLOPs as Opus 3. We don't know that, but if you extrapolate based on how Llama3 scaled, you get that it would take 13x to 32x the compute. (Various other measures I tried roughly lined up with that too.) In other words, Opus 3 was as good as scaling up Claude 1.0 13x to 32x, but only took 2.5x the compute.
So 20 / 2.5 = 8x CM in the year between Claude 1.0 and Opus 3. That's an average of 1.005713 CM per day, so if we assume the rate of progress was the same for the 8 months between Claude 3.5 and 4 that's a 4x CM.
Estimating from individual CMs
There are multiple sources of pretraining compute multipliers: better pretraining data, a better training process that requires less tokens for the same capabilities, and better architectures.
A 2x CM is so high it's assumed that there must have been accidental training on test data
So a normalish CM is maybe around 1.2? And maybe there'd be a few of them between model releases? Maybe we'll have ~6 ~1.2x CMs or ~4 ~1.3x CMs, for a ~3x CM between Claude 3.5 and Claude 4. I'm not sure if that's reasonable?
Working out the rest of the data points
If we assume a 3x CM for Claude 3.5 to Claude 4, then the grid lines are about 10x apart. 3x seems roughly reasonable given my estimates above, and it would make sense for the gridlines to be 10x apart each. Here's a widget Claude made where you can try different values for that first step, and see what that implies.
If you use try a CM of 5x for the first step it implies a total CM of ~3.3M and 10x would imply ~2.1B. Those would be absurdly and unreasonably large, so the first step CM is probably in the 3-4 region.
What the graph means
Keep in mind that you can improve pretraining performance on code just by changing the data mix (swapping out non-code documents for code documents). That would improve performance on code to the detriment of non-code. Anthropic has always had a lot of focus on making models good for coding, but I think it's fair to assume that they've been tilting the data mix more towards code since Claude 3.7 Sonnet (released February 2025) which was released alongside Claude Code. I doubt this skews the graph too much though.
Conclusion
Let me know if you have any questions! I'd love it if Anthropic was more transparent here; it seems valuable for them to communicate about the rate of progress in AI development.
This transcript strongly implies that the only reason it was stopped was because Anthropic's lawyers advised that it should be stopped (presumably due to copyright concerns).
I think that graph is just pretrain compute, but it's not entirely clear to me. This doesn't matter too much though, since we only actually need the number for lark which I guess probably had >99% of compute spent on pretraining.
Super interesting research! Glad you did some more investigating with the Anthropic court documents, I haven't really seen anyone else doing that.
That said I think this is basically "what could a banana cost, $10?"
So a normalish CM is maybe around 1.2? And maybe there'd be a few of them between model releases? Maybe we'll have ~6 ~1.2x CMs or ~4 ~1.3x CMs, for a ~3x CM between Claude 3.5 and Claude 4. I'm not sure if that's reasonable?
GPT-6 Astra probably took 3 or more months of pre-training, so there's a strict upper bound of 1.4x CM/month (57x/yr) before they'd be better off just restarting the run in the middle.
3x/yr is a common estimate to see (from this 2024 paper), it's harder after reasoning models but I had Claude research it for more recent changes (doesn't seem obviously wrong)
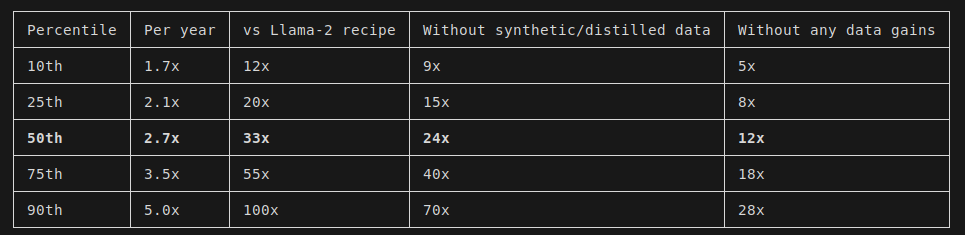
Claude: "At the scale of real open flagship runs (about 1e24–1e25 FLOP), my best estimate is that a late-2026 open recipe needs about 33x less pretraining compute than a 2023 Llama-2-style dense recipe"
Even if Anthropic has way better researchers, you wouldn't expect them to beat the open-source slope (before 2026 brought good internal models) since they'd have to beat their last model, which already has gigabrain architecture/data.
Btw your first footnote says pre-training isn't as applicable to RSI. I recently saw this https://magic.dev/blog/pretraining which seems very misleading but does feel like (limited) evidence against that in particular.
Anthropic's IPO roadshow video has a graph. It shows four models; I think dot 1 = Claude 3.5, dot 2 = Claude 4, dot 3 = Mythos, arrowhead = unreleased model.
The graph provided doesn't have any numbers on the Y axis. In this post I'll explain why I think the Y axis lines most likely represent a 10x jump each, and so the point at the end of the graph represents about a 30000x CM (i.e. Anthropic can currently pretrain models at the same quality with 1/30000th of the compute it needed in 2024). I'm pretty unsure about this though and it could plausibly be much higher or much lower. Keep in mind that this graph is only about pretraining and doesn't say anything about post-training.[1]
Without extra context, it's hard to say how much the compute has actually been multiplied: if each Y gridline is 1.1x the total multiplier would be about 1.53x; if each Y gridline is 10x the total multiplier would be about 30000x. (It's not clear to me why the last point is an arrowhead instead of a dot - maybe it's supposed to be their guess of what the compute multiplier will end up at for their latest pretraining run?)
What people in the IPO roadshow video say about compute multipliers
Sam McCandlish said (while that graph was displayed):
Tom Brown said:
Krishna Rao (CFO) said:
What is a CM?
From a deposition, a pretraining researcher explains what CMs are a bit better than the roadshow video:
Working backwards to estimate the actual compute multipliers
If we can estimate the CM from Claude 3.5 to Claude 4, we can work out where the rest of the points on the graph should be based on that. Here I try to estimate that number very roughly.
Model codename reference
We know the codenames from this filing, and some of the compute numbers from this graph.
Codename
Model
Training compute
junior
Unreleased model from mid-2022
4.2e24 FLOPs
finch
Stopped pretraining run from late 2022[2]
lark
Claude 1 (released March 2023)
1.6e25 FLOPs
eagle
Claude Instant (released March 2023)
eagle2
Claude Instant 1.1
2.0e24 FLOPs
tern
Claude 2 (released August 2023)
teal
Claude 3 Opus (released March 2024)
dove
Claude 3.5 Sonnet (released June 2024)
I believe lark is approximately finch but without training data from LibGen or PiLiMi, which hurt performance. I believe tern (Claude 2) was likely the same architecture as lark, and possibly continued pretraining on lark. Teal was almost certainly a fresh pretrain and a new architecture.[3]
Estimating Claude 1.0 -> Opus 3 CM
Claude 1 was pretrained with 1.6e25 FLOPs. We don't know how many FLOPs Claude 3 had, but it probably had around the same number of parameters as Claude 1 ("Lark [Claude 1] is actually too big, so Teal [Claude 3 Opus] will likely not be that much larger") but with much more data and a better architecture.
This graph[4] from an internal presentation shows that the actual amount of compute used to train Claude 1.0 was about 1.6e25 FLOPs. Extrapolating that graph to when Opus 3 pretraining finished would give 7.4e25 FLOPs. For various kinda complicated reasons[5] I think this is too high and it's actually more like ~4e25 FLOPs. So Opus 3 had ~2.5x the pretraining compute as Claude 1.0.
To calculate the 1.0 -> Opus 3 CM correctly we'd have to know how good 1.0 would be if we scaled it up to use as many FLOPs as Opus 3. We don't know that, but if you extrapolate based on how Llama3 scaled, you get that it would take 13x to 32x the compute. (Various other measures I tried roughly lined up with that too.) In other words, Opus 3 was as good as scaling up Claude 1.0 13x to 32x, but only took 2.5x the compute.
So 20 / 2.5 = 8x CM in the year between Claude 1.0 and Opus 3. That's an average of 1.005713 CM per day, so if we assume the rate of progress was the same for the 8 months between Claude 3.5 and 4 that's a 4x CM.
Estimating from individual CMs
There are multiple sources of pretraining compute multipliers: better pretraining data, a better training process that requires less tokens for the same capabilities, and better architectures.
For data quality related CMs:
So a normalish CM is maybe around 1.2? And maybe there'd be a few of them between model releases? Maybe we'll have ~6 ~1.2x CMs or ~4 ~1.3x CMs, for a ~3x CM between Claude 3.5 and Claude 4. I'm not sure if that's reasonable?
Working out the rest of the data points
If we assume a 3x CM for Claude 3.5 to Claude 4, then the grid lines are about 10x apart. 3x seems roughly reasonable given my estimates above, and it would make sense for the gridlines to be 10x apart each. Here's a widget Claude made where you can try different values for that first step, and see what that implies.
If you use try a CM of 5x for the first step it implies a total CM of ~3.3M and 10x would imply ~2.1B. Those would be absurdly and unreasonably large, so the first step CM is probably in the 3-4 region.
What the graph means
Keep in mind that you can improve pretraining performance on code just by changing the data mix (swapping out non-code documents for code documents). That would improve performance on code to the detriment of non-code. Anthropic has always had a lot of focus on making models good for coding, but I think it's fair to assume that they've been tilting the data mix more towards code since Claude 3.7 Sonnet (released February 2025) which was released alongside Claude Code. I doubt this skews the graph too much though.
Conclusion
Let me know if you have any questions! I'd love it if Anthropic was more transparent here; it seems valuable for them to communicate about the rate of progress in AI development.
This makes it less useful for understanding RSI dynamics, since task-based RL is very important for model performance at model R&D.
This transcript strongly implies that the only reason it was stopped was because Anthropic's lawyers advised that it should be stopped (presumably due to copyright concerns).
This seems pretty clear to me, some evidence is that Claude 3 models use a different tokenizer than earlier ones.
I think that graph is just pretrain compute, but it's not entirely clear to me. This doesn't matter too much though, since we only actually need the number for lark which I guess probably had >99% of compute spent on pretraining.
I might explain this in a later post