Thank you for writing this post and tracking down everyone's stated beliefs and updates!
I fear MNM only operated in this case because the prosocial intervention of isolating yourself also happened to be a very selfishly effective intervention. In my view, what this community failed to predict is simply that other people would, with some delay, come to the same conclusions and act as this community did, i.e. going into some degree of isolation to protect themselves. It's a pretty embarrassing failure! I distinctly recall expecting that aggregate behavior wo
...Nice post! Agree on most conclusions except I put more weight on the herd immunity threshold being not much lower than the naive compartment models imply.
Serology data from the 1968 flu pandemic seem to rule out large effects of heterogeneity on the final attack rate. First wave seropositivity was ~35% (mostly 25-50%) with an R0 of ~1.5. R0 increased in the second wave to ~2.5, and seropositivity ended up mostly around 60-70%.
People claiming big heterogeneity impacts seem to have focused on models over empirics. Unfortunately the range of effects implied b...
Some very encouraging developments. There is a PCR protocol that can test 100,000 samples in a single machine run, making millions of samples per day feasible, ignoring sample collection capacity. On that front, FDA just approved (EUA, limited scope for now) a sample collection protocol relying on saliva samples rather than nasopharyngeal swabs (would mean enormous increase in sample collection capacity). The prospects for plan #1 look dramatically better.
On plan #3, I was hoping this would work as a backup or low-tech option for poor countries but it look
...I was completely wrong, I don't think their data is subject to this worry. They now have a preprint up. From supplementary methods:
We define daily fever counts as the number of unique users per region that take multiple elevated temperature (37.7 C) readings over the past week, and then normalize these counts by the estimated number of unique users who have used the thermometer over the past year.
So lots of repeat readings shouldn't affect the gauge, and neither should more of their user base taking readings. Unless they are seeing a lot of new ...
Mass testing seems like a promising brute force strategy that can keep R < 1 after lockdown, without requiring contact tracing. I'm pretty early in thinking about this but wanted to share my thoughts to encourage parallel efforts. A few possibilities (not mutually exclusive):
1) RNA testing: If everyone is given a daily RNA test and positives are isolated, transmission will likely be very close to 0. The US is still a factor of 1000 away from doing this (for comparison, RNA testing has scaled by 400x in the last month). However it seems likely that ...
The Kinsa data is barely even weak evidence in favor of R0 < 1. The downward trend in fever readings are confounded, likely severely, by their thermometers having to be actively used vs. being a passive wearable. It seems plausible that more people will check their temperature when they are concerned about COVID-19, and since most people are healthy this will spuriously drive average fever readings down. Plausibly the timing of increased thermometer use will coincide somewhat with shelter-in-place orders since they correlate with severity & awarenes...
Non manufacturing index just came out: 52.5, down 4.8 points. More affected than manufacturing but still in expansion. Confusing.
I would focus on the ISM non-manufacturing index over the manufacturing PMI since this recession is, in the short run, primarily a services recession. Non-manufacturing index will probably be hit harder and will be more indicative of Q1 GDP.
More generally, past indicators of GDP are probably going to lose some reliability. The sectoral breakdown and rapid timing & severity of the current shock are unique enough for many historical correlations to break down. Normally less important things like survey periods will also affect monthly time series more gi...
This looks sketchy to say the least (e.g all citations are self citations), but seems worth doing a very shallow dive into or pointing out if clearly flawed: claim that yogurt can prevent secondary bacterial pneumonia in COVID-19 patients. The argument seems to at least imply that secondary bacterial pneumonia leading to cytokine storm is a common pathway to fatal cases.
(H/t Rob Wiblin on Twitter)
Their paper is not relevant as they do not analyze testing & contact tracing AT ALL, only mentioning it briefly in the Discussion section. I think everyone who thinks the strategy I describe might be feasible (which now seems to be most informed participants in the discussion on here & rationalist Twitter) more or less agrees with the Ferguson analysis if you assume you can't do testing & tracing & isolation or they won't work.
It looks like widespread border closures are inevitable now, and border policy will become even more visibly important if/when community transmission is brought under control in a country (e.g. as in China today where ~100% of new cases outside Hubei are imported). So I don't think advocating for border closures is high leverage at the moment.
I agree that it's super high leverage to get the public and policymakers to understand that it's not too late for eradication (R0 < 1) through strong social distancing, and that it may be feasible to keep secondary
...If you first do lockdowns to get new cases to ~0 and then relax, optimistically you will get localized epidemics that you can contain with widespread testing, contact tracing, and distancing if needed. Cost of testing & tracing and having to do occasional local/regional lockdowns could end up being manageable until treatment/vaccine arrives.
My main reason for optimism is Korea's and China's success containing a large outbreak. We will be expecting the secondary epidemics and reacting quickly, so they will be small when detected, so should be much easie
...Yeah I got better hospitalization/ICU rates from Bucky and upped beta to 0.3 in uncontrolled scenario to make a point on Twitter. Hospital/ICU bed availability % is graphed in each scenario tab, by overcapacity I mean the inverse of availability. Alternatively take ratio of peak to line in the Charts tab. Looks like ~15x and 5x now for hospital beds.
I meant sodium hypochlorite
Thanks for digging these up! I updated the model. Still terrible.
I used overall US numbers. I didn't consider capacity expansion but also didn't take out already-occupied beds, as I think both are roughly on the order of 2-5x in opposite directions. The only Bay Area-specific numbers are population and day 0 infected (I assumed ~10x confirmed cases).
China locked down Wuhan at ~500 confirmed cases and many other Hubei cities the next day, which immediately lowered transmission (see Chart 7 here) to R0 below 1. This is very far from the uncontrolled scenario and still overloaded the health care system. This is much of the point of the post I linked -- the degree of hospital overload in an uncontrolled scenario is so high that even huge reductions in transmission don't realistically avoid overload if R0 stays above 1.
Thanks! I didn't realize how effective bleach is. I recently moved and didn't get around to stocking up on any alcohol until it was out of stock in most places. I am expecting a shipment of industrial ethanol (still available, just don't ingest/get on your skin) but the bleach will arrive sooner. Thanks again.
You're probably right.
I should have made it clearer I don't deny we can literally flatten the curve, but rather the idea that
most people get exposed but slowly enough to not overwhelm the health care system.
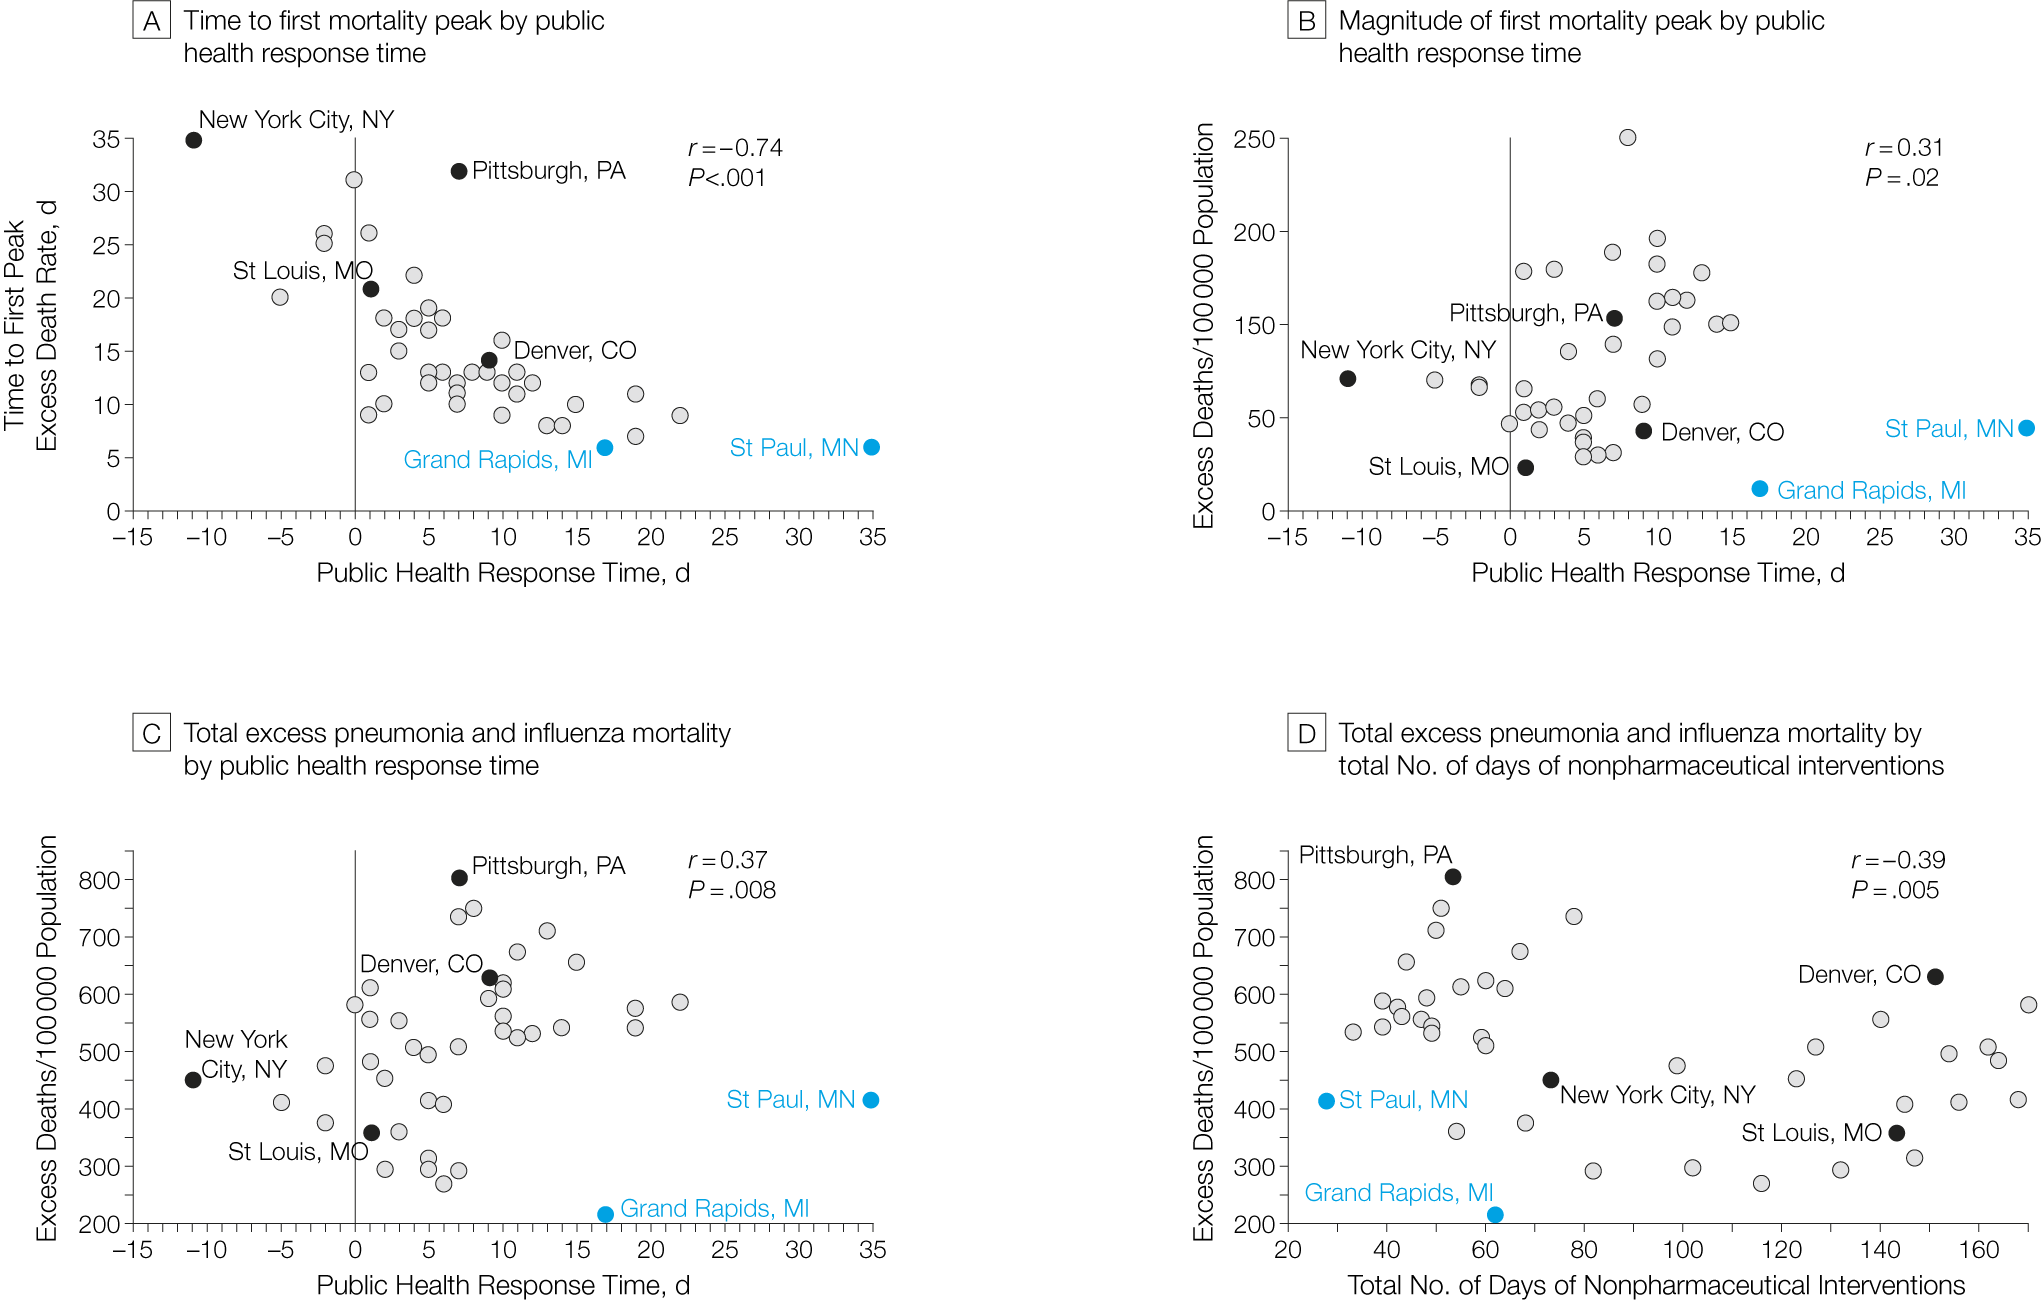
Unclear to me how well St Louis did on the health care system front. Also, the pairing of Philadelphia and St Louis is a bit convenient if you consider the raw scatterplot (panel C bottom left - ETA Philadelphia is the dot closest to Pittsburgh per this table).
Still seems to me like you should be able to isolate those problem areas from the rest of the country. Then even if you can't contain the epidemic inside, you spare most of the country (for the moment). But I think we mostly agree. A scenario that seems increasingly likely to me is that governments will intervene in increasingly strict ways until we get very close to true containment (before ~15% of the world is infected), and then will loosen movement restrictions in more-contained areas while playing whack-a-mole with a sequence of localized outbreaks for 1-2 years until a vaccine is ready.
I don't know how other people react. I took the epidemic fairly seriously but my initial reaction to the meme was one of reassurance/complacency - OK so I can't avoid eventual exposure anymore, but at least things will proceed in a somewhat orderly fashion if we cancel big events, wash hands, stop touching our face, etc. I feel like this is the sort of attitude that contributes to, and allows the public to accept, decisions like the capitulation in Sacramento. The mental image of mitigation is "basically trying to mitigate the risk to those ...
I saw the meme as mostly targeting people who were currently even more complacent "eh, there's nothing we can do, so fuck it", and getting them to instead go "okay, there's stuff that's actually worth doing."
Thanks for pointing me in this direction. I think the key worry highlighted in the post is that the health care system gets overwhelmed with even just a few percent of the population being infected. So even if we can bring peak infections down by a factor of 2-4 by slowing transmission, the health care system is still going to be creamed at the peak.
I've now built a discrete-time, Bay Area version of the SIR model (+ hospitalization) in this Google sheet. I assume 20% of infections need hospitalization, of which 20% need intensive care, and use raw be...
Don't recall how I ended up seeing it, but it was through this tweet by the author: https://twitter.com/DanielFalush/status/1236918870780198912 (ETA: Razib Khan RT'd him)
This blog post argues that the now popular idea of "flattening the curve", in the sense that most people get exposed but slowly enough to not overwhelm the health care system, is not feasible. The result is that we'll either achieve containment or at least widespread regional health care system collapse (and maybe Wei Dai's global health care collapse outcome). I haven't spent much time modeling this yet, but tentatively it looks like flattening the curve requires very precise fine-tuning of R0 to stay on a path very close to 1 for...
Disclaimer: I don't know if this is right, I'm reasoning entirely from first principles.
If there is dispersion in R0, then there would likely be some places where the virus survives even if you take draconian measures. If you later relax those draconian measures, it will begin spreading in the larger population again at the same rate as before.
In particular, if the number of cases is currently decreasing overall most places, then soon most of the cases will be in regions or communities where containment was less successful and so the number of ca...
That's a really interesting blog post, and it made me update (towards the idea that containment efforts in most countries will keep ramping up until containment actually succeeds). How did you come across it? I've been following Twitter, a couple of FB groups, and Reddit, and it didn't get linked by any of the posts I saw.
It feels to me now that flattening the curve is just a nice graphic without anyone checking the math, but I am confused that many informed-seeming experts are promoting the idea. Anything I’m missing?
I'm wondering this too.
That's an interesting question that seems like it ought to be able to be checked numerically.
I made an attempt using this simulator of the fairly-naive "SIR" model of disease transmission:
Note that this simulator appears to be someone's class project. However, its behavior seems to track more or less with what I'd expect. But I'd love for someone with more experience to reproduce this relatively simple model and check it.
...How should I disinfect objects with complex surfaces (e.g. box cutters, door knobs) if I don't have access to alcohol? Is brushing with soap likely to be sufficient or should one just avoid touching these objects for a few days if they're possibly contaminated?
John Maynard Smith's Evolutionary Genetics is a classic textbook. The second edition has simulation/programming exercises after every chapter. Have fun :)
Your beliefs imply likelihood ratios of ~10 and ~70 for bisexuality and sociopathy respectively (assuming base rates of 2-3% and 1%, respectively). What do you think you know and how do you think you know it?
Hayrff guvf vf gevpxvre guna vg frrzf, whfg gur svefg zbzrag bs rnpu qvfgevohgvba fubhyq qb. (Sbe guvf ernfba V qvfnterr gung gur Jvxv negvpyr vzcyvpvgyl nffhzrf vasvavgr fnzcyr fvmr. Gur pbaqvgvbany cebonovyvgvrf hfrq va gur pnyphyngvba ner gur svefg zbzragf (= pbafgnagf) bs gur erfcrpgvir cnenzrgre qvfgevohgvbaf, abg gur cnenzrgref gurzfryirf (= enaqbz inevnoyrf).)
The narration in the passage is extremely suggestive that someone other than McGonagall was at work. Dumbledore and Quirrell used to be the main candidate hypotheses for who it was, until this chapter basically confirmed it was Dumbledore.
Aww, so Dumbledore was the one who told Harry to look for Hermione on the train in chapter 6 :)
Donated $100.
Contact info sent.
You shouldn't care much about omega-3/6 ratio in grains because they don't usually have much of either. Same for meat.
I think I know the difference between changes in supply and movement along the supply curve, and your post confuses me. I take the OP's point to be that, in the long run, a change in demand shifts the short-run supply curve. This is exactly the sort of long-run dynamics scenario McAfee talks about (section 4.2.2, e.g. figures on p. 106). Is McAfee wrong or am I really missing something?
If you look at net worth counterfactuals, the person deciding whether to borrow money to buy BTC is facing the same decision as someone who is already in debt and is deciding whether to buy BTC or use the same money to pay off some of their debt. If you think leveraged investments in BTC are unwise, you should also categorically advise people with any amount of debt to not buy BTC.
Empirically, some industries are approximately constant-cost, others are increasing- and decreasing-cost. OP mentioned certain factors pushing one way or the other, but ultimately the slope of the long-run supply curve of an industry is determined by which factors predominate, so we'd have to measure it to be sure. What is generally true, however, is that long-run supply is typically highly elastic, so cost doesn't change much from marginal changes in demand.
Looking at the extremes doesn't tell you that chicken production is an increasing-cost industry at the margin. Sure input costs are important (the OP agrees - see last section), but there are also economies of scale, R&D investment, and so on pushing the other way, so it's ultimately an empirical matter whether chicken production is increasing- or decreasing-cost at current levels of production (again I'm just repeating what the OP says).
IMO this issue is actually less relevant than the OP seems to think, because we're only talking about very small mar...
To get the retailer to buy less chicken, you'd have to cut consumption enough to exceed their threshold for allowable waste.
This strikes me as compatible with what gjm said in the sentence before the one you quoted. Some chicken-buying decisions will make no difference, and others are going to have a disproportionate effect by hitting some threshold. In aggregate, chicken purchases by a supermarket have to equal their chicken sales (plus inventory breakage), so a pretty good guess for the expected impact of buying one less chicken is that one less chick...
Hubbard recommends a few commercial Monte Carlo tools for risk analysis that seem very related: Oracle Crystal Ball, @Risk, XLSim, Risk Solver Engine, Analytica.
Neat write-up. I'd say that the scale elasticity of Cost is also irrelevant, since vegetarianism promotion only has a small marginal effect on scale.
This was more of a side effect of deciding to pare down on my possessions than an intervention specifically aimed at buying fewer books, but I rarely buy books anymore just because I want to read them. I get books on LibGen or at the university library. In the rare event in which a book turns out to be a really valuable reference I may then buy it.
I found the links by googling "green card marriage".
It looks like marrying specifically for US residency purposes is illegal. This report gives the impression that only a tiny fraction of people actually get prosecuted. You'll have to convincingly lie to a consul and likely undergo some investigation (see e.g. here).
Time, legal risk, reputation. The opportunity cost is lower if you were going to marry a random/non-specific person anyway, but I'm assuming you're asking about a sham marriage that you're going to end later.
I forget the details, but I think the argument intentionally focuses on ancestor simulations for epistemic reasons, to preserve a similarity between the simulating and simulated universes. If you don't assume that the basement-level universe is quite similar to our own, it's hard to reason about its computational resources. It's also hard to tell in what proportion a totally different civilization would simulate human civilizations, hence the focus on ancestor simulations. I'm not sure if this is a conservative assumption (giving some sort of lower bound) or just done for tractability.
ETA: See FAQs #4 and #11 here.
I'd be surprised if fake marriages turned out to be the most cost-effective way to help poor people immigrate to the US, even if you want to focus on refugees specifically.
Huh, thanks. Not sure how I managed to misremember so specifically. Edited post.
Wait, are you expecting positive total returns from stocks over the next few months? If so, this is very non-obvious from your post.