You can remove GPT2’s LayerNorm by fine-tuning for an hour
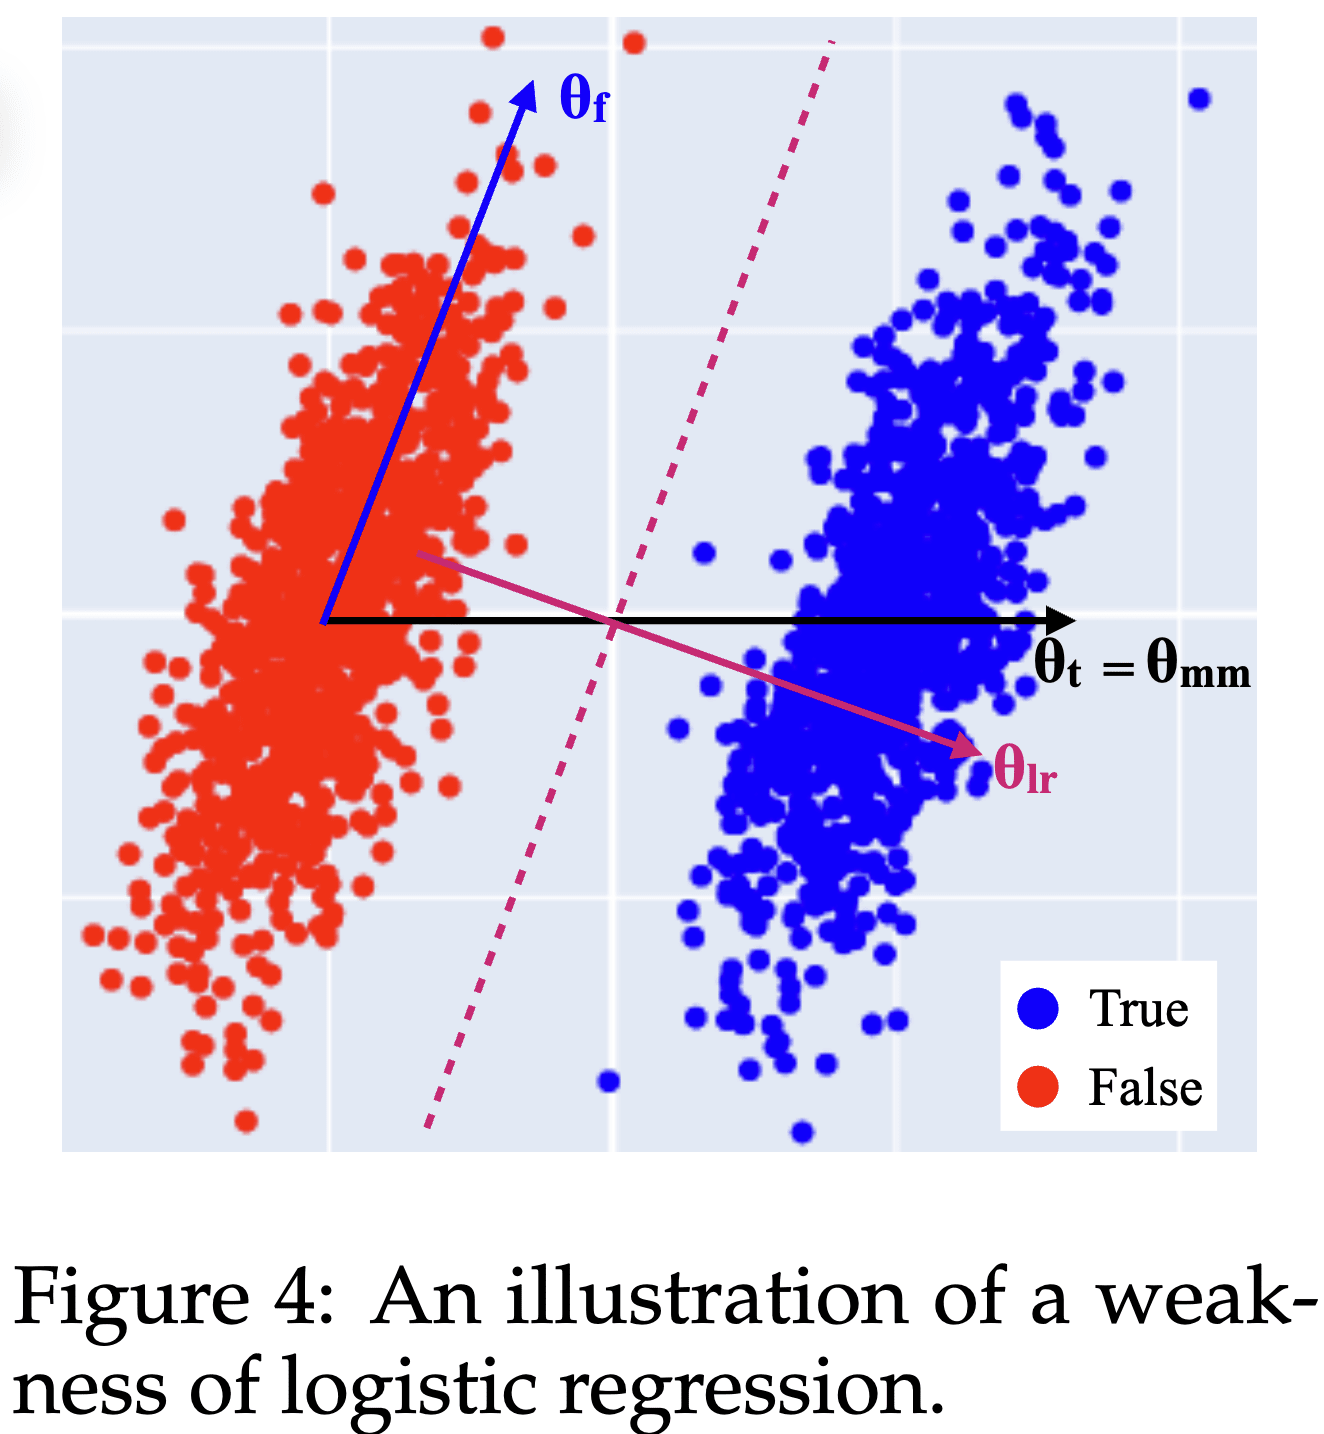
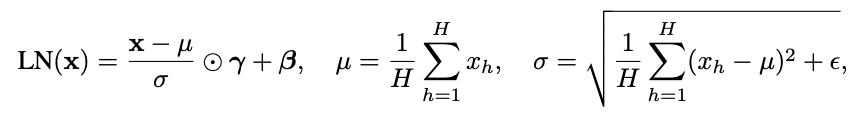
This work was produced at Apollo Research, based on initial research done at MATS. Edit: arXiv version available at https://arxiv.org/abs/2409.13710 LayerNorm is annoying for mechanistic interpretability research (“[...] reason #78 for why interpretability researchers hate LayerNorm” – Anthropic, 2023). Here’s a Hugging Face link to a GPT2-small model without any LayerNorm. The final model is only slightly worse than a GPT2 with LayerNorm[1]: DatasetOriginal GPT2Fine-tuned GPT2 with LayerNormFine-tuned GPT without LayerNormOpenWebText (ce_loss)3.0952.9893.014 (+0.025)ThePile (ce_loss)2.8562.8802.926 (+0.046)HellaSwag (accuracy)29.56%29.82%29.54% I fine-tuned GPT2-small on OpenWebText while slowly removing its LayerNorm layers, waiting for the loss to go back down after reach removal: Introduction LayerNorm (LN) is a component in Transformer models that normalizes embedding vectors to have constant length; specifically it divides the embeddings by their standard deviation taken over the hidden dimension. It was originally introduced to stabilize and speed up training of models (as a replacement for batch normalization). It is active during training and inference. LN(x)=x−E[x]√Var[x]+ϵ⋅γ+β The equation includes the standard deviation (std) √Var[x]+ϵ which makes it a non-linear operation. This hinders interpretability in a variety of ways, from annoyances and inaccuracies such as * attributing residual stream directions to logit effects (e.g. SAE features, direct logit attribution),[2] * being annoying to deal with Attribution Patching, or * being difficult to deal with in Apollo’s LIB method. In the Docstring circuit analysis we seriously considered whether the model might be using LN in its algorithm. This post even shows that LN can be used as the sole non-linearity to solve non-linear classification problems (see also this related work). Recently, with progress in Sparse Dictionary Learning, agendas (e.g. this one) imagine decomposing networks int
Could you elaborate, or does it boil down to "Helping Claude would have taking 2 days, and doing it on your own would have been faster"? I would be keen for patterns that help me distinguish between