This is a special post for quick takes by StefanHex. Only they can create top-level comments. Comments here also appear on the Quick Takes page and All Posts page.
Treat your obfuscated chains of thought like live bioweapons.
I've spoken to a few folks at NeurIPS that are training reasoning models against monitors for various reasons (usually to figure out how to avoid unmonitorable chain of thought). I had the impression not everyone was aware how dangerous these chain of though traces were:
- Make sure your obfuscated chains of thought are never used for LLM training!
If obfuscated reasoning gets into the training data, this could plausibly teach models how to obfuscate their reasoning. This seems potentially pretty bad (a bit like gain of function research). I'm not saying you shouldn't do the research, it's probably worth the risk. Just make sure to keep the rollouts away from training:
- Use e.g. the easy-dataset-share package (by TurnTrout et al.) to protect your dataset when you upload it somewhere (e.g. GitHub, HuggingFace).
- Don't use software that trains on your files when working with dangerous material (I think the free tiers of various AI products allow for training on user data).
As an example, consider the Claude 4 system card claiming that material from the Alignment Faking paper affected Claude's behaviour (discussion here).
Credit to pl...
glad people are noticing. it won't be enough to stop all leaks though, realistically.
it's fun how all the safety worries and intricate plans to prevent failure modes tend to get invalidated by "humans do the thing the bypasses the guardrails". e.g. for years people would say things like "of course we won't connect it to the internet/let it design novel viruses/proteins/make lethal autonomous weapons".
my guess is the law of less dignified failure has a lot of truth to it.
Here's an IMO under-appreciated lesson from the Geometry of Truth paper: Why logistic regression finds imperfect feature directions, yet produces better probes.
Consider this distribution of True and False activations from the paper:
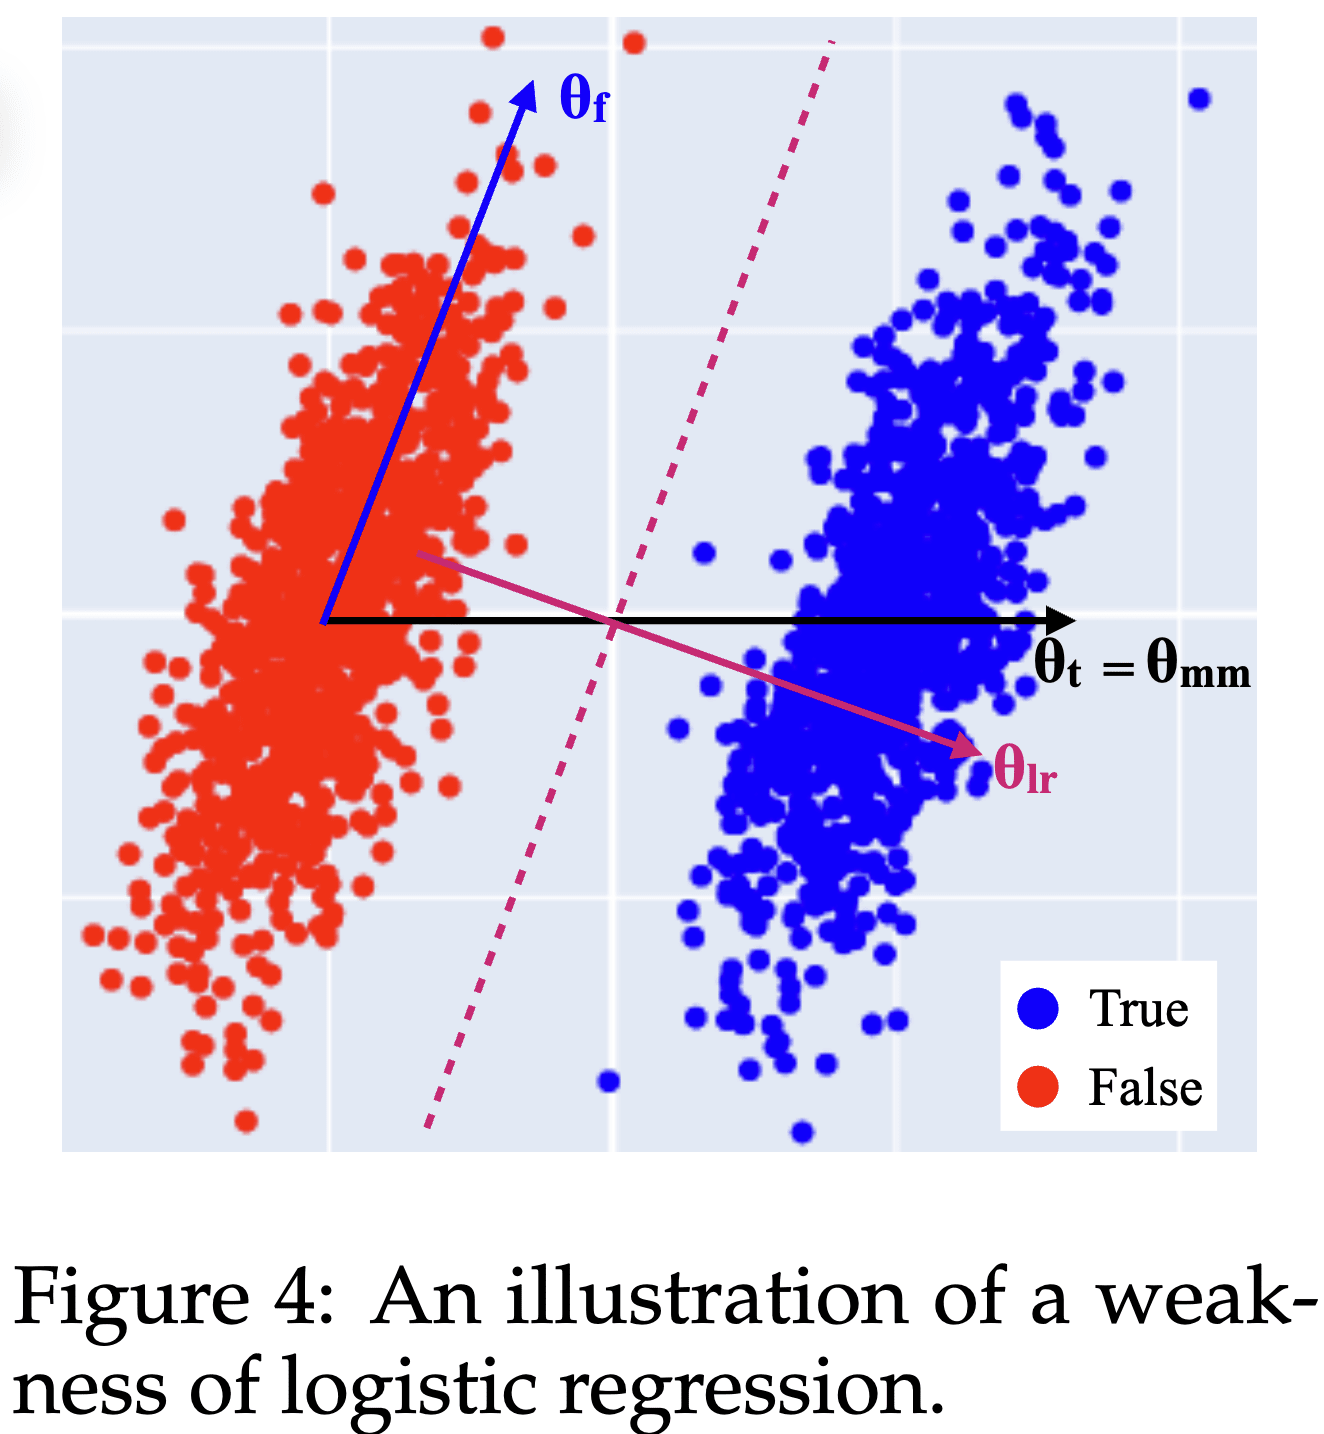
The True and False activations are just shifted by the Truth direction . However, there also is an uncorrelated but non-orthogonal direction along which the activations vary as well.
The best possible logistic regression (LR) probing direction is the direction orthogonal to the plane separating the two clusters, . Unintuitively, the best probing direction is not the pure Truth feature direction !
- This is a reason why steering and (LR) probing directions differ: For steering you'd want the actual Truth direction [1], while for (optimal) probing you want .
- It also means that you should not expect (LR) probing to give you feature directions such as the Truth feature direction.
The paper also introduces mass-mean probing: In the (uncorrelated) toy scenario, you can obtain the pure Truth feature direction from the difference between the distribution centroids .
- Contrastive methods (like mass
A fun side note, that probably isn't useful - I think if you shuffle the data across neurons (which effectively gets rid of the covariance amongst neurons), and then do linear regression, you will get theta_t.
This is a somewhat common technique in neuroscience analysis when studying correlation structure in neural reps and separability.
8
I just chatted with Adam and he explained a bit more, sumarising this here: What the shuffling does is creating a new dataset from each category (x1,y17),(x2,y12),(x3,y5),... where the x and y pairs are shuffled (or in high dimensions, the sample for each dimension is randomly sampled). The shuffle leaves the means (centroids) invariant, but removes correlations between directions. Then you can train a logistic regression on the shuffled data. You might prefer this over calculating the mean directly to get an idea of how much low sample size is affecting your results.
2
Is this guaranteed to give you the same as mass-mean probing?
Thinking about it quickly, consider the solution to ordinary least squares regression. With a y that is one-hot encoding the label, it is (XTX)−1XTy. Note that XTX=N⋅Cov(X,X) . The procedure Adam describes makes it so that the sample of Xs becomes uncorrelated, which is exactly the same as zeroing out the non-diagonal elements of the covariance.
If the covariance is diagonal, then (XTX)−1 is also diagonal, and it follows that the solution to OLS is indeed an unweighted average of the datapoints that correspond to each label! Each dimension of the data x is multiplied by some coefficient, one per dimension corresponding to the diagonal of the covariance.
I'd expect logistic regression to choose the ~same direction.
Very clever technique!
Edited to fix errors pointed out by @JoshEngels and @Adam Karvonen (mainly: different definition for explained variance, details here).
Summary: K-means explains 72 - 87% of the variance in the activations, comparable to vanilla SAEs but less than better SAEs. I think this (bug-fixed) result is neither evidence in favour of SAEs nor against; the Clustering & SAE numbers make a straight-ish line on a log plot.
Epistemic status: This is a weekend-experiment I ran a while ago and I figured I should write it up to share. I have taken decent care to check my code for silly mistakes and "shooting myself in the foot", but these results are not vetted to the standard of a top-level post / paper.
SAEs explain most of the variance in activations. Is this alone a sign that activations are structured in an SAE-friendly way, i.e. that activations are indeed a composition of sparse features like the superposition hypothesis suggests?
I'm asking myself this questions since I initially considered this as pretty solid evidence: SAEs do a pretty impressive job compressing 512 dimensions into ~100 latents, this ought to mean something, right?
But maybe all SAEs are doing is "dataset clustering" (the d...
I was having trouble reproducing your results on Pythia, and was only able to get 60% variance explained. I may have tracked it down: I think you may be computing FVU incorrectly.
https://gist.github.com/Stefan-Heimersheim/ff1d3b92add92a29602b411b9cd76cec#file-clustering_pythia-py-L309
I think FVU is correctly computed by subtracting the mean from each dimension when computing the denominator. See the SAEBench impl here:
https://github.com/adamkarvonen/SAEBench/blob/5204b4822c66a838d9c9221640308e7c23eda00a/sae_bench/evals/core/main.py#L566
When I used your FVU implementation, I got 72% variance explained; this is still less than you, but much closer, so I think this might be causing the improvement over the SAEBench numbers.
In general I think SAEs with low k should be at least as good as k means clustering, and if it's not I'm a little bit suspicious (when I tried this first on GPT-2 it seemed that a TopK SAE trained with k = 4 did about as well as k means clustering with the nonlinear argmax encoder).
Here's my clustering code: https://github.com/JoshEngels/CheckClustering/blob/main/clustering.py
2
You're right. I forgot subtracting the mean. Thanks a lot!!
I'm computing new numbers now, but indeed I expect this to explain my result! (Edit: Seems to not change too much)
4
After adding the mean subtraction, the numbers haven't changed too much actually -- but let me make sure I'm using the correct calculation. I'm gonna follow your and @Adam Karvonen's suggestion of using the SAE bench code and loading my clustering solution as an SAE (this code).
These logs show numbers with the original / corrected explained variance computation; the difference is in the 3-8% range.
v3 (KMeans): Layer blocks.3.hook_resid_post, n_tokens=1000000, n_clusters=4096, variance explained = 0.8887 / 0.8568
v3 (KMeans): Layer blocks.3.hook_resid_post, n_tokens=1000000, n_clusters=16384, variance explained = 0.9020 / 0.8740
v3 (KMeans): Layer blocks.4.hook_resid_post, n_tokens=1000000, n_clusters=4096, variance explained = 0.8044 / 0.7197
v3 (KMeans): Layer blocks.4.hook_resid_post, n_tokens=1000000, n_clusters=16384, variance explained = 0.8261 / 0.7509
PCA+Clustering: Layer blocks.3.hook_resid_post, n_tokens=1000000, n_clusters=4095, n_pca=1, variance explained = 0.8910 / 0.8599
PCA+Clustering: Layer blocks.3.hook_resid_post, n_tokens=1000000, n_clusters=16383, n_pca=1, variance explained = 0.9041 / 0.8766
PCA+Clustering: Layer blocks.3.hook_resid_post, n_tokens=1000000, n_clusters=4094, n_pca=2, variance explained = 0.8948 / 0.8647
PCA+Clustering: Layer blocks.3.hook_resid_post, n_tokens=1000000, n_clusters=16382, n_pca=2, variance explained = 0.9076 / 0.8812
PCA+Clustering: Layer blocks.3.hook_resid_post, n_tokens=1000000, n_clusters=4091, n_pca=5, variance explained = 0.9044 / 0.8770
PCA+Clustering: Layer blocks.3.hook_resid_post, n_tokens=1000000, n_clusters=16379, n_pca=5, variance explained = 0.9159 / 0.8919
PCA+Clustering: Layer blocks.3.hook_resid_post, n_tokens=1000000, n_clusters=4086, n_pca=10, variance explained = 0.9121 / 0.8870
PCA+Clustering: Layer blocks.3.hook_resid_post, n_tokens=1000000, n_clusters=16374, n_pca=10, variance explained = 0.9232 / 0.9012
PCA+Clustering: Layer blocks.3.hook_resid_post, n_tokens=1000000, n_clusters=4076, n_pc
8
this seems concerning. Can somebody ELI5 what's going on here?
this seems concerning.
I feel like my post appears overly dramatic; I'm not very surprised and don't consider this the strongest evidence against SAEs. It's an experiment I ran a while ago and it hasn't changed my (somewhat SAE-sceptic) stance much.
But this is me having seen a bunch of other weird SAE behaviours (pre-activation distributions are not the way you'd expect from the superposition hypothesis h/t @jake_mendel, if you feed SAE-reconstructed activations back into the encoder the SAE goes nuts, stuff mentioned in recent Apollo papers, ...).
Reasons this could be less concerning that it looks
- Activation reconstruction isn't that important: Clustering is a strong optimiser -- if you fill a space with 16k clusters maybe 90% reconstruction isn't that surprising. I should really run a random Gaussian data baseline for this.
- End-to-end loss is more important, and maybe SAEs perform much better when you consider end-to-end reconstruction loss.
- This isn't the only evidence in favour of SAEs, they also kinda work for steering/probing (though pretty badly).
2
Tentatively I get similar results (70-85% variance explained) for random data -- I haven't checked that code at all though, don't trust this. Will double check this tomorrow.
(In that case SAE's performance would also be unsurprising I suppose)
2
Is there a benchmark in which SAEs clearly, definitely outperform standard techniques?
4
I'm not sure what you mean by "K-means clustering baseline (with K=1)". I would think the K in K-means stands for the number of means you use, so with K=1, you're just taking the mean direction of the weights. I would expect this to explain maybe 50% of the variance (or less), not 90% of the variance.
But anyway, under my current model (roughly Why I'm bearish on mechanistic interpretability: the shards are not in the network + Binary encoding as a simple explicit construction for superposition) it seems about as natural to use K-means as it does to use SAEs, and not necessarily an issue if K-means outperforms SAEs. If we imagine that the meaning is given not by the dimensions of the space but rather by regions/points/volumes of the space, then K-means seems like a perfectly cromulent quantization for identifying these volumes. The major issue is where we go from here.
4
I think this is what I care about finding out. If you're right this is indeed not surprising nor an issue, but you being right would be a major departure from the current mainstream interpretability paradigm(?).
The question of regions vs compositionality is what I've been investigating with my mentees recently, and pretty keen on. I'll want to write up my current thoughts on this topic sometime soon.
4
Thanks for pointing this out! I confused nomenclature, will fix!
Edit: Fixed now. I confused
* the number of clusters ("K") / dictionary size
* the number of latents ("L_0" or k in top-k SAEs). Some clustering methods allow you to assign multiple clusters to one point, so effectively you get a "L_0>1" but normal KMeans is only 1 cluster per point. I confused the K of KMeans and the k (aka L_0) of top-k SAEs.
3
I think he messed up the lingo a bit, but looking at the code he seems to have done k-means with a number of clusters similar to the number of SAE latents, which seems fine.
2
Same plot but using SAEBench's FVU definition. Matches this Neuronpedia page.
2
I'm going to update the results in the top-level comment with the corrected data; I'm pasting the original figures here for posterity / understanding the past discussion. Summary of changes:
1. [Minor] I didn't subtract the mean in the variance calculation. This barely had an effect on the results.
2. [Major] I used a different definition of "Explained Variance" which caused a pretty large difference
Old (no longer true) text:
1
I think the relation between K-means and sparse dictionary learning (essentially K-means is equivalent to an L_0=1 constraint) is already well-known in the sparse coding literature? For example see this wiki article on K-SVD (a sparse dictionary learning algorithm) which first reviews this connection before getting into the nuances of k-SVD.
Were the SAEs for this comparison trained on multiple passes through the data, or just one pass/epoch? Because if for K-means you did multiple passes through the data but for SAEs just one then this feels like an unfair comparison.
1
What do you mean you’re encoding/decoding like normal but using the k means vectors? Shouldn’t the SAE training process for a top k SAE with k = 1 find these vectors then?
In general I’m a bit skeptical that clustering will work as well on larger models, my impression is that most small models have pretty token level features which might be pretty clusterable with k=1, but for larger models many activations may belong to multiple “clusters”, which you need dictionary learning for.
4
So I do something like
latents_tmp = torch.einsum("bd,nd->bn", data, centroids)
max_latent = latents_tmp.argmax(dim=-1) # shape: [batch]
latents = one_hot(max_latent)
where the first line is essentially an SAE embedding (and centroids are the features), and the second/third line is a top-k. And for reconstruction do something like
recon = centroids @ latents
which should also be equivalent.
Yes I would expect an optimal k=1 top-k SAE to find exactly that solution. Confused why k=20 top-k SAEs to so badly then.
If this is a crux then a quick way to prove this would be for me to write down encoder/decoder weights and throw them into a standard SAE code. I haven't done this yet.
5
I just tried to replicate this on GPT-2 with expansion factor 4 (so total number of centroids = 768 * 4). I get that clustering recovers ~87% fraction of variance explained, while a k = 32 SAE gets more like 95% variance explained. I did the nonlinear version of finding nearest neighbors when using k means to give k means the biggest advantage possible, and did k-means clustering on points using the FAISS clustering library.
Definitely take this with a grain of salt, I'm going to look through my code and see if I can reproduce your results on pythia too, and if so try on a larger model to. Code: https://github.com/JoshEngels/CheckClustering/tree/main
What's up with different LLMs generating near-identical answers?
TL,DR: When you ask the same question you often get the same answer. These feel way more deterministic that I'd expect based on webtext probabilities (pre-training). Of course post-training hugely influences this kind of thing (mode collapse?), it's just more striking that I had thought.
Following this post, I asked "Tell me a funny joke":
- GPT o3: "Why don’t scientists trust atoms anymore? Because they make up everything! 😁 Want to hear another one, or maybe something in a different style?"
- Claude 3.7 Sonnet (thinking): "Why don't scientists trust atoms? Because they make up everything!"
- Gemini 2.5 Pro (preview): "Why don't scientists trust atoms? Because they make up everything!"
What's going on here? Asking for five more jokes from each model, I only get one overlapping one ("Why don't skeletons fight each other? They don't have the guts.", from Claude and Gemini).
I've also tried "Tell me your #1 fact about the ocean":
- GPT o3: "More than half of every breath you take is thanks to the ocean — tiny, photosynthetic plankton drifting in sun-lit surface waters generate at least 50 % of Earth’s oxygen supply."
- Claude: "My
5
An untested hypothesis:
LLMs are fundamentally text predictors. There are many high-probability replies to "Tell me a funny joke", so you wouldn't necessarily expect them all to tell the same one. But perhaps, somewhere in the training data, someone published their conversation with an LLM in which they said "Tell me a funny joke" and it replied with the joke about atoms. Next-gen LLMs learn from this training data that if an LLM is asked to tell a joke, the probability-maximizing answer is that particular joke. So now they all start telling the same joke.
Why can't the mode-collapse just be from convergent evolution in terms of what the lowest-common denominator rater will find funny? If there are only a few top candidates, then you'd expect a lot of overlap. And then there's the very incestuous nature of LLM training these days: everyone is distilling and using LLM judges and publishing the same datasets to Hugging Face and training on them. That's why you'll ask Grok or Llama or DeepSeek-R1 a question and hear "As an AI model trained by OpenAI...".
2
From Auren. Note we had just been talking about church planting, and Auren has no way to reset state. We'd also previously talked about my taste in stand-up comics.
Collection of some mech interp knowledge about transformers:
Writing up folk wisdom & recent results, mostly for mentees and as a link to send to people. Aimed at people who are already a bit familiar with mech interp. I've just quickly written down what came to my head, and may have missed or misrepresented some things. In particular, the last point is very brief and deserves a much more expanded comment at some point. The opinions expressed here are my own and do not necessarily reflect the views of Apollo Research.
Transformers take in a sequence of tokens, and return logprob predictions for the next token. We think it works like this:
- Activations represent a sum of feature directions, each direction representing to some semantic concept. The magnitude of directions corresponds to the strength or importance of the concept.
- These features may be 1-dimensional, but maybe multi-dimensional features make sense too. We can either allow for multi-dimensional features (e.g. circle of days of the week), acknowledge that the relative directions of feature embeddings matter (e.g. considering days of the week individual features but span a circle), or both. See also Jake Mendel's
3
This is a nice overview, thanks!
I don't think I've seen the CLDR acronym before, are the arguments publicly written up somewhere?
Also, just wanted to flag that the links on 'this picture' and 'motivation image' don't currently work.
3
CLDR (Cross-layer distributed representation): I don't think Lee has written his up anywhere yet so I've removed this for now.
Thanks for the flag! It's these two images, I realize now that they don't seem to have direct links
Images taken from AMFTC and Crosscoders by Anthropic.
3
Thanks for the great writeup.
Typo: I think you meant to write distributed, not local, codes. A local code is the opposite of superposition.
4
Thanks! You're right, totally mixed up local and dense / distributed. Decided to just leave out that terminology
3[anonymous]
Who is "we"? Is it:
1. only you and your team?
2. the entire Apollo Research org?
3. the majority of mechinterp researchers worldwide?
4. some other group/category of people?
Also, this definitely deserves to be made into a high-level post, if you end up finding the time/energy/interest in making one.
5
Thanks for the comment!
I think this is what most mech interp researchers more or less think. Though I definitely expect many researchers would disagree with individual points, nor does it fairly weigh all views and aspects (it's very biased towards "people I talk to"). (Also this is in no way an Apollo / Apollo interp team statement, just my personal view.)
2
this is great, thanks for sharing
Against multi-page forms.
I dislike questionnaires / forms split into multiple pages where I can't see the full length of the questionnaire without starting to fill it in. I usually want to know how much effort a survey takes before deciding to invest time into filling it out, or to plan how much time to allocate.
Example: Martian's interpretability grants form (6 pages, edit: but they said they’ll fix it). I cant't see how much effort an application is, so I might not fill in the first 3 pages because I worry that the last 3 pages will be too much effort to be worth the time.
Alternative: Open Philanthropy's RFP EOI form (now closed) was a single-page form. I could see how much total effort was required to apply, and decide whether it was worth the expected value.
Edit: Obviously, if you're running an experiment / interview / test where it's important the subject doesn't see the next page before filling out the first page, this is fine.
2
PMore generally: anything split into (ridiculously small) pages (such as e.g. a thread in a web forum, search engine results, list of bank movements, etc.) for no good reason -- with an "entries per page" menu whose options don't even span orders of magnitude (e.g. 10, 15, 20, 25, 30).
Unless a page has a snowball's chance in hell of taking up a sizable fraction of the RAM or taking more than a quarter second to load on a modern device with a modern connection, just keep it one page, and if you have an "entries per page" menu please provide at least 10, 100, and 1000 as option (if selecting the last would crash my browser that's my own business).
2
I often just put some random text (blah blah blah lorem ipsum) that will let me to the next pages and then go back if I decide I want to submit the thing.
1
Yeah, Tinker's Research Grant form is another example of a multi-page form: https://form.typeform.com/to/E9wVFZJJ
0
I think the correct way to do forms is to always tell me how many questions the form have and the expected time needed by actually trying to fill the form 1 or more times. If you let me know this upfront I care less how many pages you do, but ideally you split pages only when you have conditional questions. Exceptions exist though, e.g. a team competition signup form where you fill in information about multiple people in the same form probably should have 1 page per person. However if you arent doing conditional questions I should always always be able to go to the next page without the dumb fuck validations stopping me.
PSA: People use different definitions of "explained variance" / "fraction of variance unexplained" (FVU)
is the formula I think is sensible; the bottom is simply the variance of the data, and the top is the variance of the residuals. The indicates the norm over the dimension of the vector . I believe it matches Wikipedia's definition of FVU and R squared.
is the formula used by SAELens and SAEBench. It seems less principled, @Lucius Bushnaq and I couldn't think of a nice quantity it corresponds to. I think of it as giving more weight to samples that are close to the mean, kind-of averaging relative reduction in difference rather than absolute.
A third version (h/t @JoshEngels) which computes the FVU for each dimension independently and then averages, but that version is not used in the context we're discussing here.
In my recent comment I had computed my own , and compared it to FVUs from SAEBench (which used ) and obtained nonsense results.
Curiously the two definitions seem to be approximately proportional—below I show the pe...
8
I would be very surprised if this FVU_B actually another definition and not a bug. It's not a fraction of the variance and those denominators can easily be zero or very near zero.
2
https://github.com/jbloomAus/SAELens/blob/main/sae_lens/evals.py#L511 sums the numerator and denominator separately, if they aren't doing that in some other place probably just file a bug report?
2
I think this is the sum over the vector dimension, but not over the samples. The sum (mean) over samples is taken later in this line which happens after the division
metrics[f"{metric_name}"] = torch.cat(metric_values).mean().item()
Edit: And to clarify, my impression is that people think of this as alternative definitions of FVU and you got to pick one, rather than one being right and one being a bug.
Edit2: And I'm in touch with the SAEBench authors about making a PR to change this / add both options (and by extension probably doing the same in SAELens); though I won't mind if anyone else does it!
4
Ah, oops. I think I got confused by the absence of L_2 syntax in your formula for FVU_B. (I agree that FVU_A is more principled ^^.)
2
Oops, fixed!
1
This was really helpful, thanks! just wanting to clear up my understanding:
This is the wikipedia entry for FVU:
where:
There's no mention of norms because (as I understand) y and ^y are assumed to be scalar values so SSerr and SStot are scalar. Do I understand it correctly that you're treating ∥xn−xn,pred∥2 as the multi-dimensional equivalent of SSerr and ∥xn−μ∥2 as the multi-dimensional equivalent of SStot? This would make sense as using the squared norms of the differences makes it basis / rotation invariant.
3
Yep, that’s the generalisation that would make most sense
1
Thanks. Also, in the case of crosscoders, where you have multiple output spaces, do you have any thoughts on the best way to aggregate across these? currently I'm just computing them separately and taking the mean. But I could see imagine it perhaps being better to just concat the spaces and do fvu on that, using l2 norm of the concated vectors.
2
Yeah you probably shouldn't concat the spaces due to things like "they might have very different norms & baseline variances". Maybe calculate each layer separately, then if they're all similar average them together, otherwise keep separate and quote as separate numbers in your results
1
FVU_B doesn't make sense but I don't see where you're getting FVU_B from.
Here's the code I'm seeing:
resid_sum_of_squares = (
(flattened_sae_input - flattened_sae_out).pow(2).sum(dim=-1)
)
total_sum_of_squares = (
(flattened_sae_input - flattened_sae_input.mean(dim=0)).pow(2).sum(-1)
)
mse = resid_sum_of_squares / flattened_mask.sum()
explained_variance = 1 - resid_sum_of_squares / total_sum_of_squares
Explained variance = 1 - FVU = 1 - (residual sum of squares) / (total sum of squares)
2
I think this is the sum over the vector dimension, but not over the samples. The sum (mean) over samples is taken later in this line which happens after the division
metrics[f"{metric_name}"] = torch.cat(metric_values).mean().item()
1
Let's suppose that's the case. I'm still not clear on how are you getting to FVU_B?
2
The previous lines calculate the ratio (or 1-ratio) stored in the “explained variance” key for every sample/batch. Then in that later quoted line, the list is averaged, I.e. we”re taking the sample average over the ratio. That’s the FVU_B formula.
Let me know if this clears it up or if we’re misunderstanding each other!
Memorization in LLMs is probably Computation in Superposition (CiS, Vaintrob et al., 2024).
CiS is often considered a predominantly theoretical concept. I want to highlight that most memorization in LLMs is probably CiS. Specifically, the typical CiS task of "compute more AND gates than you have ReLU neurons" is exactly what you need to memorize lots of facts. I'm certainly not the first one to say this, but it also doesn't seem common knowledge. I'd appreciate pushback or references in the comments!
Consider the token “Michael”. GPT-2 knows many things about Michael, including a lot of facts about Michael Jordan and Michael Phelps, all of which are relevant in different contexts. The model cannot represent all these in the embedding of the token Michael (conventional superposition, Elhagge et al., 2022); in fact—if SAEs are any indication—the model can only represent about 30-100 features at a time.
So this knowledge must be retrieved dynamically. In the sentence “Michael Jordan plays the sport of”, a model will consider the intersection of Michael AND Jordan AND sport, resulting in basketball. Folk wisdom is that this kind of memorization is implemented by the MLP blocks in a Transf...
6
Agreed, I consider this a key theme in our fact finding work especially post 3 (but could maybe have made this more explicit) https://www.lesswrong.com/s/hpWHhjvjn67LJ4xXX/p/iGuwZTHWb6DFY3sKB
4
@Eliezer Yudkowsky If Large Language Models were confirmed to implement computation in superposition [1,2,3], rather than just representation in superposition, would you resolve this market as yes?
Representation in superposition would not have been a novel idea to computer scientists in 2006. Johnson-Lindenstrauss is old. But there's nothing I can think of from back then that'd let you do computation in superposition, linearly embedding a large number of algorithms efficiently on top each other in the same global vector space so they can all be pretty efficiently executed in parallel, without wasting a ton of storage and FLOP, so long as only a few algorithms do anything at any given moment.
To me at least, that does seem like a new piece of the puzzle for how minds can be set up to easily learn lots of very different operations and transformations that all apply to representations living in the same global workspace.
LLM activation space is spiky. This is not a novel idea but something I believe many mechanistic interpretability researchers are not aware of. Credit to Dmitry Vaintrob for making this idea clear to me, and to Dmitrii Krasheninnikov for inspiring this plot by showing me a similar plot in a setup with categorical features.
Under the superposition hypothesis, activations are linear combinations of a small number of features. This means there are discrete subspaces in activation space that are "allowed" (can be written as the sum of a small number of features), while the remaining space is "disallowed" (require much more than the typical number of features).[1]
Here's a toy model (following TMS, total features in -dimensional activation space, with features allowed to be active simultaneously). Activation space is made up of discrete -dimensional (intersecting) subspaces. My favourite image is the middle one () showing planes in 3d activation space because we expect in realistic settings.
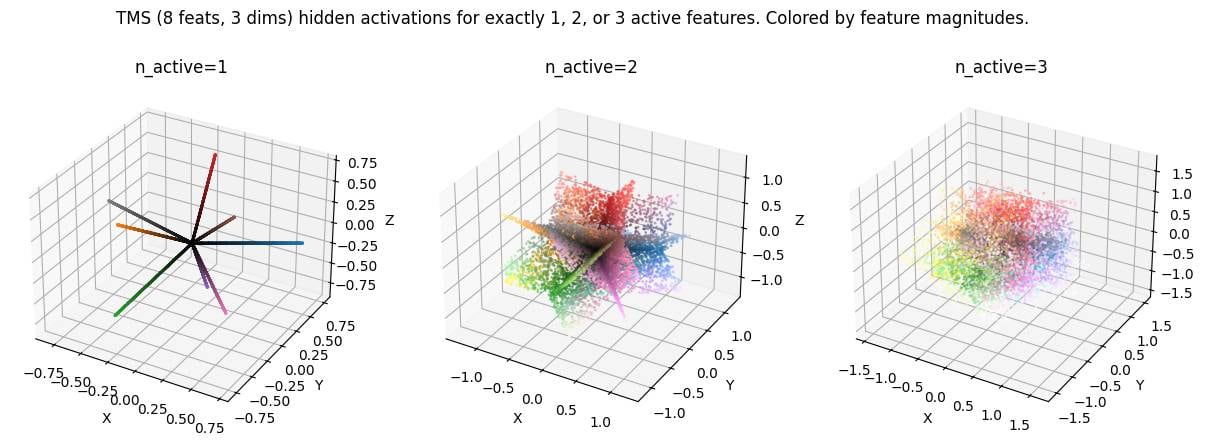
( in the plot corresponds to here. Code here.)
This picture predicts that interpolating between two activations should take you out-of-distribution ...
Is weight linearity real?
A core assumption of linear parameter decomposition methods (APD, SPD) is weight linearity. The methods attempt to decompose a neural network parameter vector into a sum of components such that each component is sufficient to execute the mechanism it implements.[1] That this is possible is a crucial and unusual assumption. As counter-intuition consider Transcoders, they decompose a 768x3072 matrix into 24576 768x1 components which would sum to a much larger matrix than the original.[2]
Trivial example where weight linearity does not hold: Consider the matrix in a network that uses superposition to represent 3 features in two dimensions. A sensible decomposition could be to represent the matrix as the sum of 3 rank-one components
If we do this though, we see that the components sum to more than the original matrix
The decomposition doesn’t work, and I can’t find any other decomposition that makes sense. However, APD claims that this matrix should be described as a sin...
6
@Lucius Bushnaq explained to me his idea of “mechanistic faithfulness”: The property of a decomposition that causal interventions (e.g. ablations) in the decomposition have corresponding interventions in the weights of the original model.[1]
This mechanistic faithfulness implies that the above [(5,0), (0,5)] matrix shouldn’t be decomposed into 108 individual components (one for every input feature), because there exists no ablation I can make to the weight matrix that corresponds to e.g. ablating just one of the 108 components.
Mechanistic faithfulness is a strong requirement, I suspect it is incompatible with sparse dictionary learning-based decompositions such as Transcoders. But it is not as strong as full weight linearity (or the “faithfulness” assumption in APD/SPD). To see that, consider a network with three mechanisms A, B, and C. Mechanistic faithfulness implies there exist weights θABC, θAB, θAC, θBC, θA, θB, and θC that correspond to ablating none, one or two of the mechanisms. Weight linearity additionally assumes that θABC=θAB+θC=θA+θB+θC etc.
1. ^
Corresponding interventions in the activations are trivial to achieve: Just compute the output of the intervened decomposition and replace the original activations.
I don't like the extensive theming of the frontpage around If Anyone Builds It, Everyone Dies.
The artwork is distracting. I just went on LW to create a new draft, got distracted, clicked on the website, and spent 3 minutes reporting a bug. I expect this is intended to some degree, but it feels a little "out to get you" to me.
Edit: The mobile site looks quite bad too (it just looks like unintended dark mode)
6
You can just deactivate it now! There is an X-button in the top right corner that hides it and resets the frontpage theme to whatever your default theme is.
We'll properly sync the mobile site opt-out with desktop sometime today. On mobile it is indeed just dark mode and it was difficult to not make it that for annoying technical reasons, but things will be back to whatever your default theme settings were sometime today when I make the relevant changes.
Why I'm not too worried about architecture-dependent mech interp methods:
I've heard people argue that we should develop mechanistic interpretability methods that can be applied to any architecture. While this is certainly a nice-to-have, and maybe a sign that a method is principled, I don't think this criterion itself is important.
I think that the biggest hurdle for interpretability is to understand any AI that produces advanced language (>=GPT2 level). We don't know how to write a non-ML program that speaks English, let alone reason, and we have no idea how GPT2 does it. I expect that doing this the first time is going to be significantly harder, than doing this the 2nd time. Kind of how "understand an Alien mind" is much harder than "understand the 2nd Alien mind".
Edit: Understanding an image model (say Inception V1 CNN) does feel like a significant step down, in the sense that these models feel significantly less "smart" and capable than LLMs.
5
Agreed. I do value methods being architecture independent, but mostly just because of this:
At scale, different architectures trained on the same data seem to converge to learning similar algorithms to some extent. I care about decomposing and understanding these algorithms, independent of the architecture they happen to be implemented on. If a mech interp method is formulated in a mostly architecture independent manner, I take that as a weakly promising sign that it's actually finding the structure of the learned algorithm, instead of structure related to the implementation on one particular architecture.
4
I think the usual reason this claim is made is because the person making the claim thinks it's very plausible LLMs aren't the paradigm that lead to AGI. If that's the case, then interpretability that's indexed heavily on them gets us understanding of something qualitatively weaker than we'd like. I agree that there'll be some transfer, but it seems better and not-very-hard to talk about how well different kinds of work transfer.
3
Agreed. A related thought is that we might only need to be able to interpret a single model at a particular capability level to unlock the safety benefits, as long as we can make a sufficient case that we should use that model. We don't care inherently about interpreting GPT-4, we care about there existing a GPT-4 level model that we can interpret.
List of some larger mech interp project ideas (see also: short and medium-sized ideas). Feel encouraged to leave thoughts in the replies below!
Edit: My mentoring doc has more-detailed write-ups of some projects. Let me know if you're interested!
What is going on with activation plateaus: Transformer activations space seems to be made up of discrete regions, each corresponding to a certain output distribution. Most activations within a region lead to the same output, and the output changes sharply when you move from one region to another. The boundaries seem...
Are the features learned by the model the same as the features learned by SAEs?
TL;DR: I want true features model-features to be a property of the model weights, and to be recognizable without access to the full dataset. Toy models have that property. My “poor man’s model-features” have it. I want to know whether SAE-features have this property too, or if SAE-features do not match the true features model-features.
Introduction: Neural networks likely encode features in superposition. That is, features are represented as directions in...
1
My core request is that I want (SAE-)features to be a property of the model, rather than the dataset.
* This can be misunderstood in the sense of taking issue with “If a concept is missing from the SAE training set, the SAE won’t find the corresponding feature.” -- no, this is fine, the model-feature exists but simply isn't found by the SAE.
* What I mean to say is I take issue if “SAEs find a feature only because this concept is common in the dataset rather than because the model uses this concept.”[1] -- in my books this is SAEs making up features and that won't help us understand models
1. ^
Of course a concept being common in the model-training-data makes it likely (?) to be a concept the model uses, but I don’t think this is a 1:1 correspondence. (So just making the SAE training set equal to the model training set wouldn’t solve the issue.)
1
There is a view that SAE features are just a useful tool for describing activations (interpretable features) and manipulating activations (useful for steering and probing). That SAEs are just a particularly good method in a larger class of methods, but not uniquely principled. In that case I wouldn't expect this connection to model behaviour.
But often we make the claim that we often make is that the model sees and understands the world as a set of model-features, and that we can see the same features by looking at SAE-features of the activations. And then I want to see the extra evidence.
List of some medium-sized mech interp project ideas (see also: shorter and longer ideas). Feel encouraged to leave thoughts in the replies below!
Edit: My mentoring doc has more-detailed write-ups of some projects. Let me know if you're interested!
Toy model of Computation in Superposition: The toy model of computation in superposition (CIS; Circuits-in-Sup, Comp-in-Sup post / paper) describes a way in which NNs could perform computation in superposition, rather than just storing information in superposition (TMS). It would be good to have some actually trai...
I've heard people say we should deprioritise fundamental & mechanistic interpretability[1] in short-timelines (automated AI R&D) worlds. This seems not obvious to me.
The usual argument is
- Fundamental interpretability will take many years or decades until we "solve interpretability" and the research bears fruits.
- Timelines are short, we don't have many years or even decades.
- Thus we won't solve interpretability in time.
But this forgets that automated AI R&D means we'll have decades of subjective research-time in months or years of wall-clock t...
5
That's basically my argument in this post, and it applies to most AI risk related activities that naively would need to proceed much further than likely actually possible before takeoff. So not just more careful kinds of interpretability, but all sorts of things, such as control-enhancing automated governance of AI bureaucracies, or agent foundations / decision theory, or saner definitions of potential eutopias.
That is, shortly before takeoff AIs might be able to prioritize and complete your project, but only if you aim them at the particular things you've worked out so far. You can only start asking the right questions (without relying on AIs asking these questions themselves) by already being deconfused enough through previous human effort.
It's only the AIs that straightforwardly get the decades of subjective research-time, while we don't. Humans would have to struggle to understand what the AIs are developing, in order to have a chance of meaningfully directing their efforts, while to a large extent being at the mercy of AI advice about how to think about what's going on.
2
Thanks for flagging this, I missed that post! The advice in the post & its comments are very useful, especially considerations like preparing to aim the AIs, setting oneself up to provide oversight to many AI agents, and whether we'll understand what the AIs are developing.
2
I think in short timelines we should relatively deprioritise longer term research bets because:
* Clearly these bets are strictly better in long timelines where you both get the AI R&D acceleration and the time leading up to this.
* It's unclear how useful work done in advance will be for providing a head start to AIs automating AI R&D. E.g., maybe if things go well these AIs reinvent all prior progress very quickly and so the key thing is getting the meta-level process of this automation to work. One key question is whether the earlier work is key for supervising AIs or helps get tons of value from relatively weak AIs.
* It's unclear when automated AI R&D yields large accelerates relative to when risk emerges and AIs might be scheming and trying to sandbag at the first point when they would otherwise be very useful. (So, easier to set up methods which aims to ensure these AIs don't sabotage work seems relatively more useful in short timelines.)
I think you probably agree that short timelines make longer term research bets some amount less useful (as you noted some other agendas become more important in short timelines). So, this is ultimately a quantitative question. I feel tempted by a perspective in which research that fully depends on massive serial acceleration gets deprioritized by ~3x conditional on short timelines (maybe <3 years) relative to >10 year timelines due to these factors.
2
To the extent AIs are not already robustly aligned superintelligences, the priorities they might put on AI risk related projects of their own initiative might be suboptimal for our purposes. If humans already have their R&D priorities straight (based on previous humans-substantially-in-the-loop research), they might be able to keep the AIs working on the right things, even if the AIs don't have sufficient propensity to go there spontaneously.
Edit: I feel less strongly following the clarification below. habryka clarified that (a) they reverted a more disruptive version (pixel art deployed across the site) and (b) that ensuring minimal disruption on deep-links is a priority.
I'm not a fan of April Fools' events on LessWrong since it turned into the de-facto AI safety publication platform.
We want people to post serious research on the site, and many research results are solely hosted on LessWrong. For instance, this mech interp review has 22 references pointing to lesswrong.com (along with 22 furt...
It's always been a core part of LessWrong April Fool's that we never substantially disrupt or change the deep-linking experience.
So while it looks like a lot of going on today, if you get linked directly to an article, you will basically notice nothing different. All you will see today are two tiny pixel-art icons in the header, nothing else. There are a few slightly noisy icons in the comment sections, but I don't think people would mind that much.
This has been a core tenet of all April Fool's in the past. The frontpage is fair game, and April Fool's jokes are common for large web platforms, but it should never get in the way of accessing historical information or parsing what the site is about, if you get directly linked to an author's piece of writing.
5
I largely retract my criticism based on this. I had thought it affected deep-links more than it does. [1]
----------------------------------------
1. I initially noticed April Fools' day after following a deep-link. I thought I had seen the font of the username all wacky (kind-of pixelated?), and thus was more annoyed. But I can't seem to reproduce this now and conclude it was likely not real. Might have been a coincidence / unrelated site-loading bug / something temporarily broken on my end. ↩︎
3
You are not imagining things! When we deployed things this morning/late last night I had a pixel-art theme deployed by default across the site, but then after around an hour decided it was indeed too disruptive to the reading experience and reverted it. Seems like we are both on roughly the same page on what is too much.
List of some short mech interp project ideas (see also: medium-sized and longer ideas). Feel encouraged to leave thoughts in the replies below!
Edit: My mentoring doc has more-detailed write-ups of some projects. Let me know if you're interested!
Directly testing the linear representation hypothesis by making up a couple of prompts which contain a few concepts to various degrees and test
- Does the model indeed represent intensity as magnitude? Or are there separate features for separately intense versions of a concept? Finding the right prompts is tricky, e.g.
We want two different kinds of probes in a white-box monitoring setup.
Say we want to monitor LLM queries for misuse or various forms of misalignment. We'll probably use a hierarchical monitoring setup (e.g. Hua et al.) with a first cheap stage, and a more expensive second stage.
When I talk to people about model internals-based probes, they typically think of probes as the first-stage filter only.
Instead, we should use probes anywhere where they're helpful. I expect we want:
- A first-stage probe (applied to all samples), optimised for low cost & high reca
Why I'm not that hopeful about mech interp on TinyStories models:
Some of the TinyStories models are open source, and manage to output sensible language while being tiny (say 64dim embedding, 8 layers). Maybe it'd be great to try and thoroughly understand one of those?
I am worried that those models simply implement a bunch of bigrams and trigrams, and that all their performance can be explained by boring statistics & heuristics. Thus we would not learn much from fully understanding such a model. Evidence for this is that the 1-layer variant, which due t...
Has anyone tested whether feature splitting can be explained by composite (non-atomic) features?
- Feature splitting is the observation that SAEs with larger dictionary size find features that are geometrically (cosine similarity) and semantically (activating dataset examples) similar. In particular, a larger SAE might find multiple features that are all similar to each other, and to a single feature found in a smaller SAE.
- Anthropic gives the example of the feature " 'the' in mathematical prose" which splits into features " 'the' in mathematics
1
I like this recent post about atomic meta-SAE features, I think these are much closer (compared against normal SAEs) to what I expect atomic units to look like:
https://www.lesswrong.com/posts/TMAmHh4DdMr4nCSr5/showing-sae-latents-are-not-atomic-using-meta-saes
I think we should think more about computation in superposition. What does the model do with features? How do we go from “there are features” to “the model outputs sensible things”? How do MLPs retrieve knowledge (as commonly believed) in a way compatible with superposition (knowing more facts than number of neurons)?
This post (and paper) by @Kaarel, @jake_mendel, @Dmitry Vaintrob (and @LawrenceC) is the kind of thing I'm looking for, trying to lay out a model of how computation in superposition could work. It makes somewhat-concrete predictions ...