I saw an article on high IQ people being excluded from elite professions. Because the site seemed to have a particular agenda related to the article, I wanted to check here for other independent supporting evidence for the claim.
Their fundamental claim seems to be that P(elite profession|IQ) peaks at 133 and decreases thereafter, and goes do to 3% of peak at 150. If true, I'd find that pretty shocking.
They indicate this diminishing probability of "success" at the high tail of the IQ distribution as a known effect. Anyone got other studies on this?
By dividing the distribution function of the elite professions' IQ by that of the general population, we can calculate the relative probability that a person of any given IQ will enter and remain in an intellectually elite profession. We find that the probability increases to about 133 and then begins to fall. By 140 it has fallen by about 1/3 and by 150 it has fallen by about 97%. In other words, for some reason, the 140s are really tough on one's prospects for joining an intellectually elite profession. It seems that people with IQs over 140 are being systematically, and likely inappropriately, excluded.
Edit: It appears I have basically just said what Gwern said but with graphs.
I can't work out what they're doing with their statistics to get the numbers they claim, because they don't show their working. I have however seen a very similar article which used the same data. In that case I believe the error came from assuming a normal distribution of intelligence in the overall population and in the faculty population.
Here are a couple of graphs I have thrown together to demonstrate what I suspect has happened:
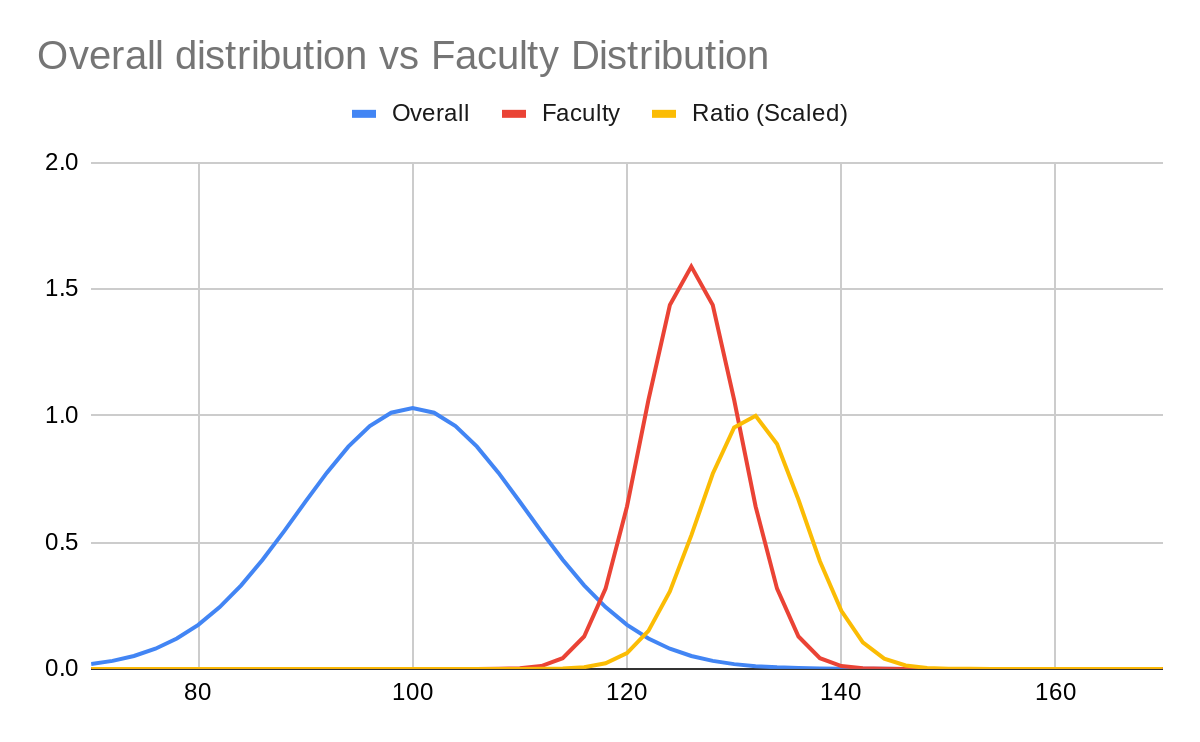
The first graph shows the distributions of the overall population (mean 100, s.d. 15) and faculty population (mean 126, s.d. 6.3) and the ratio between them (divided by ~60 so that the maximum ratio is 1 and it fits on the same graph). The ratio itself seems to peak around 133 like the article stated. So what's going on?
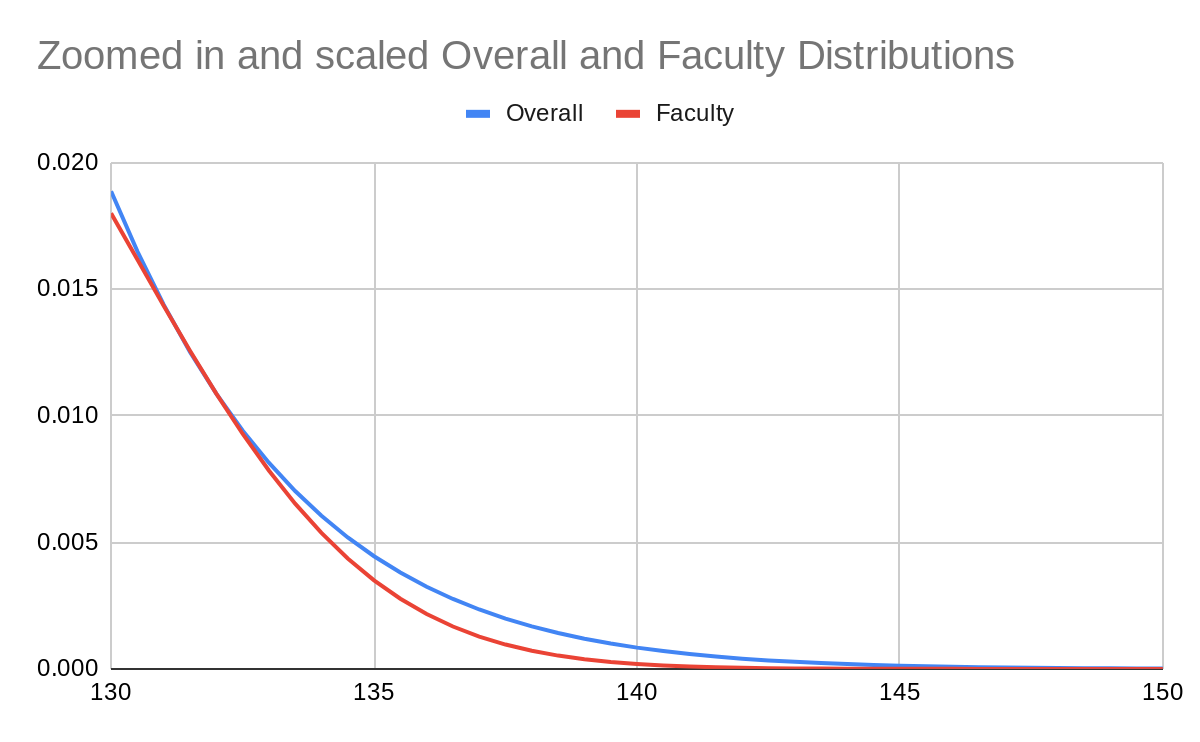
If we scale the two distributions so they line up between 130 and 150, we see that above around 133, the faculty distribution falls off faster. This is because of the smaller standard deviation. Normal distributions have the probability density function
1σ√2πexp(−(x−μ)2σ2)=1σ√2πexp(−x2σ2+2xμσ2−μ2σ2)
for standard deviation σ and mean μ.
At values of x far from the mean, the −x2 term inside the exponential dominates the rest, and so 1/σ2 dominates the value of the distribution, which is why the distribution of faculty drops off faster than the general population.
The mistake made in this case is assuming a normal distribution of faculty staff. Imagine a ratio function which looks like the one on the graph above, but above 133 remains constant and does not decrease. (This should match our priors on how university faculty hiring works). The distribution of faculty staff would look the same up to an iq of 133, but then would drop off slightly more slowly. This would be undetectable except by surveying an enormous number of faculty members. Normal distributions are a decent prior but they are not the only distributions which exist, especially when the distribution is created by filtering.
I don't know if this is what the authors of this particular article have done, because they won't tell us, but I suspect this is the sort of error they have made.