This is a thread for displaying your timeline until human-level AGI.
Every answer to this post should be a forecast. In this case, a forecast showing your AI timeline.
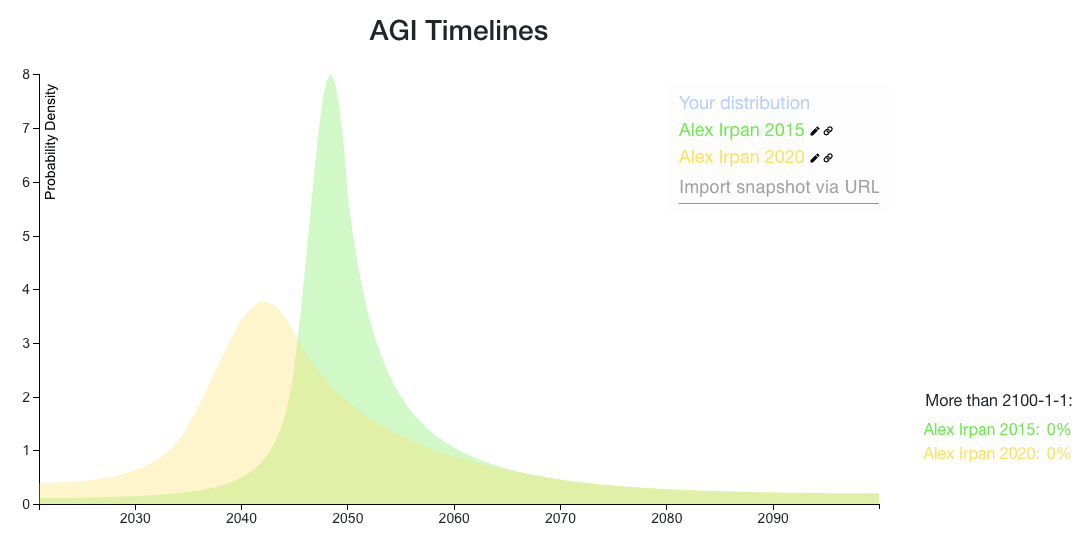
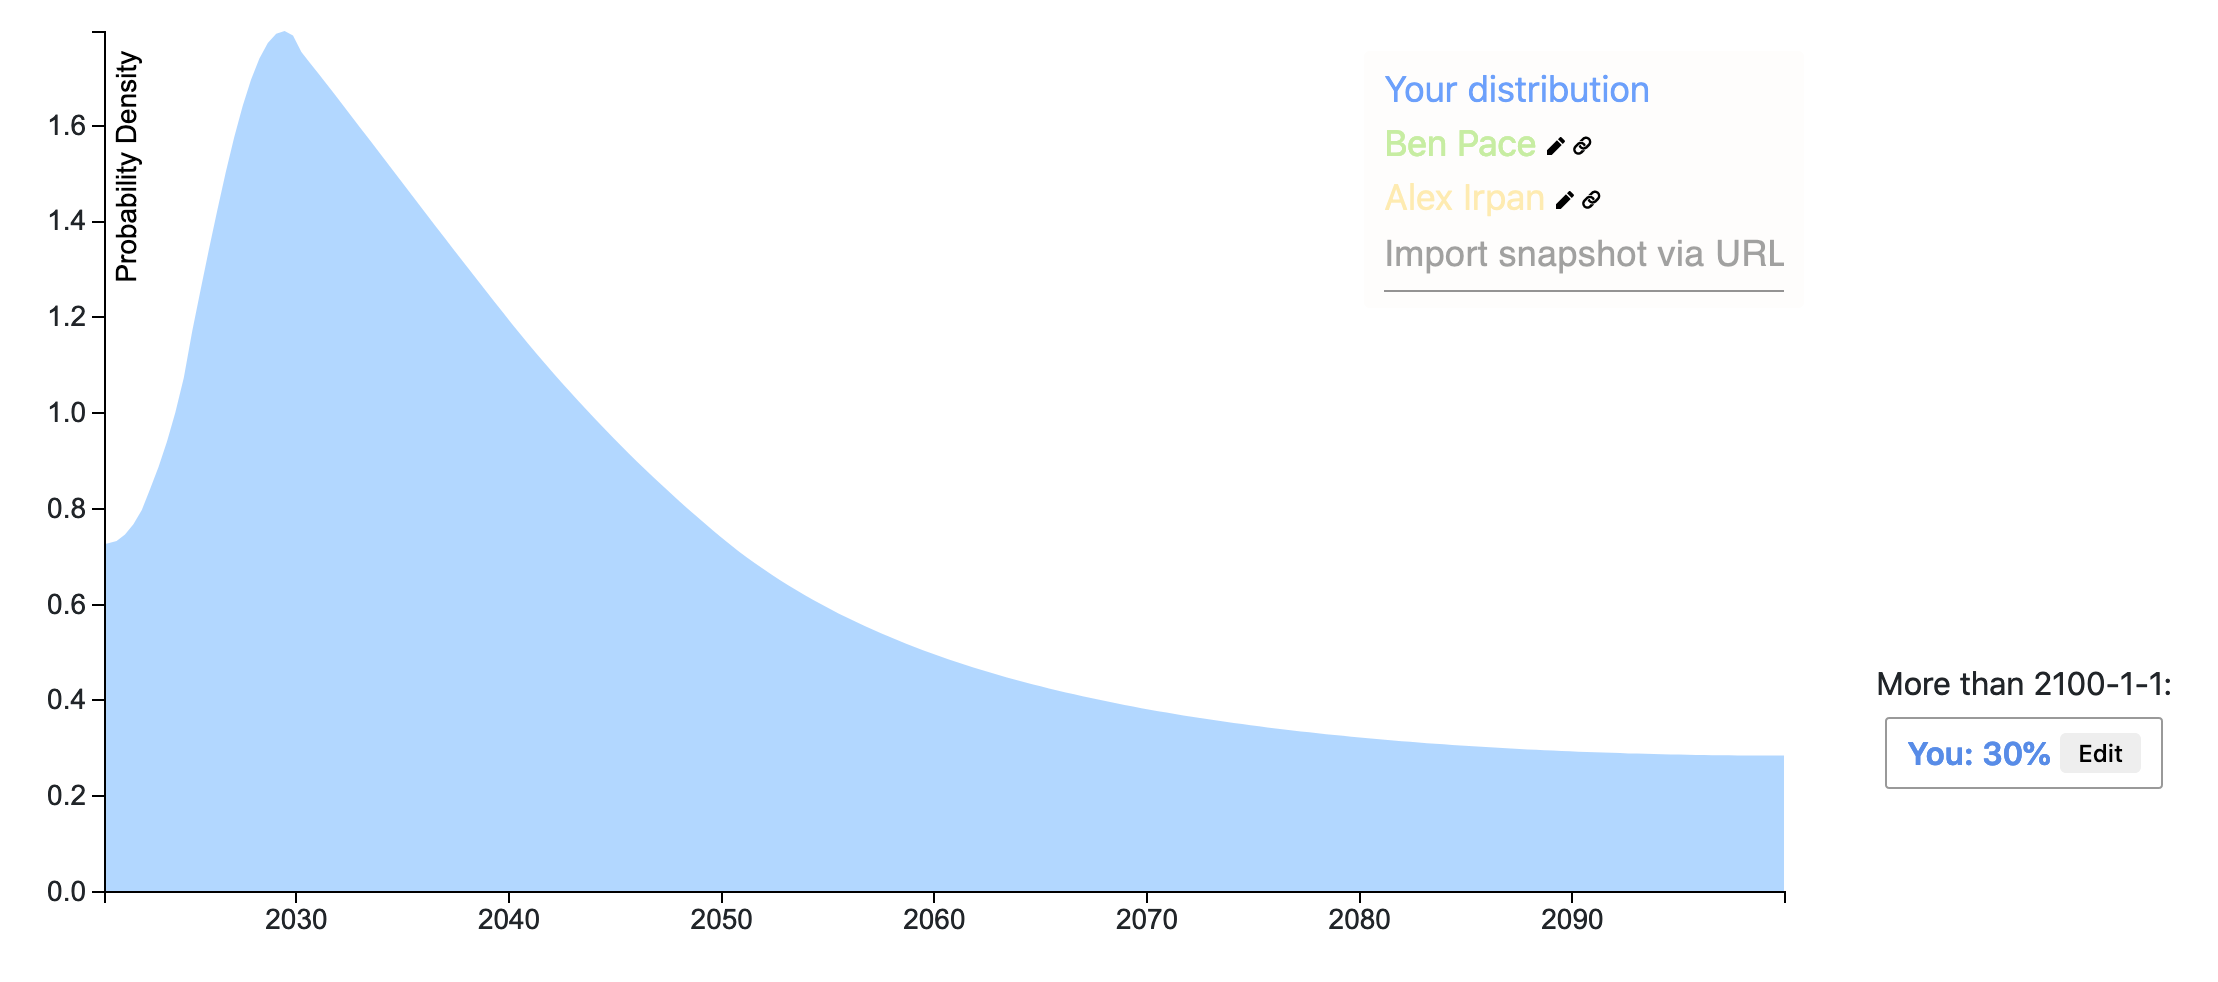
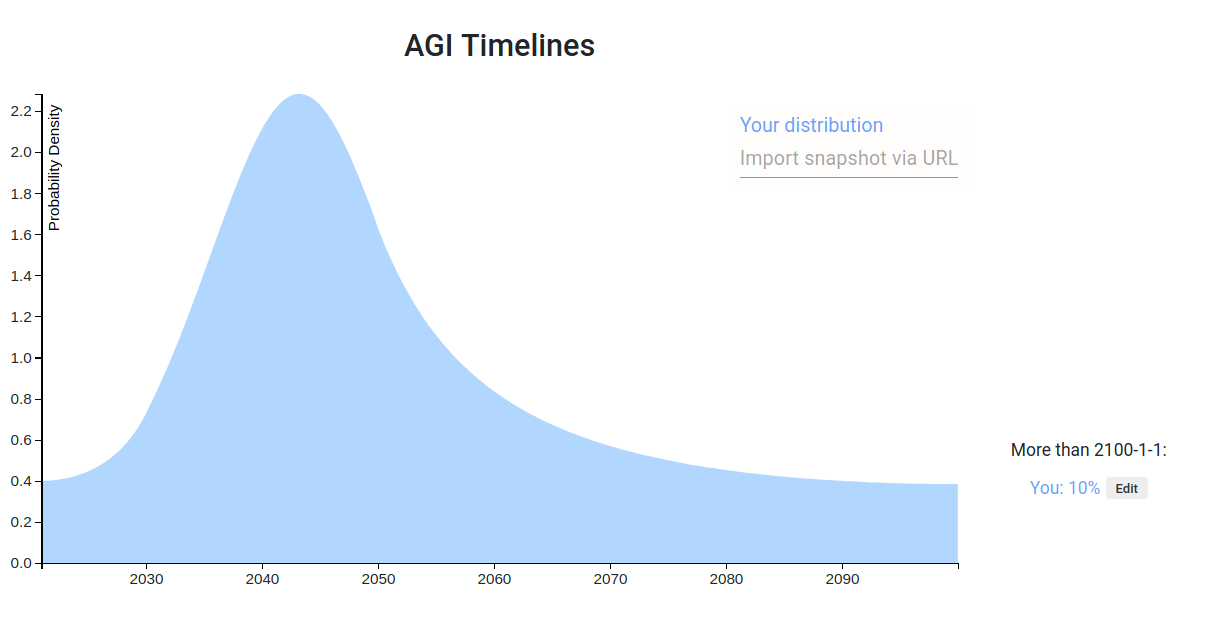
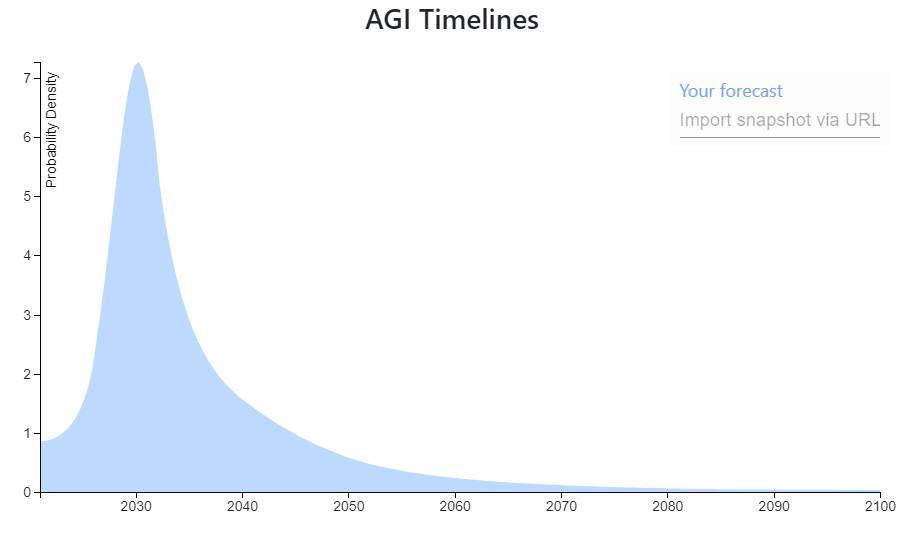
For example, here are Alex Irpan’s AGI timelines.
For extra credit, you can:
- Say why you believe it (what factors are you tracking?)
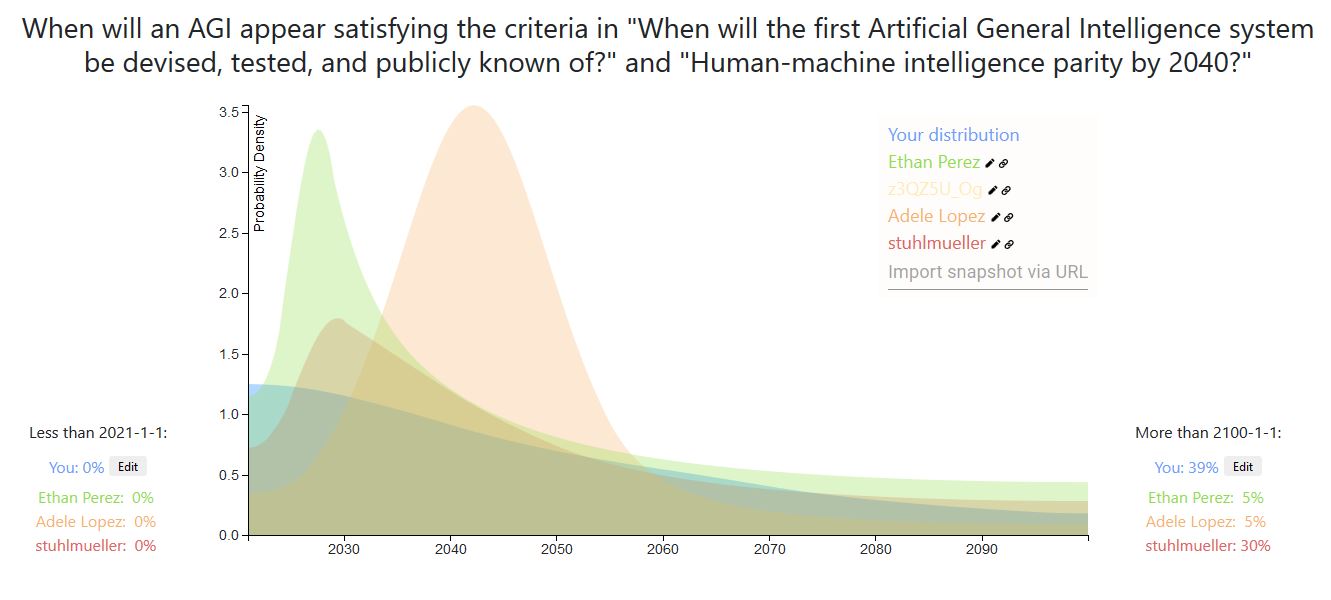
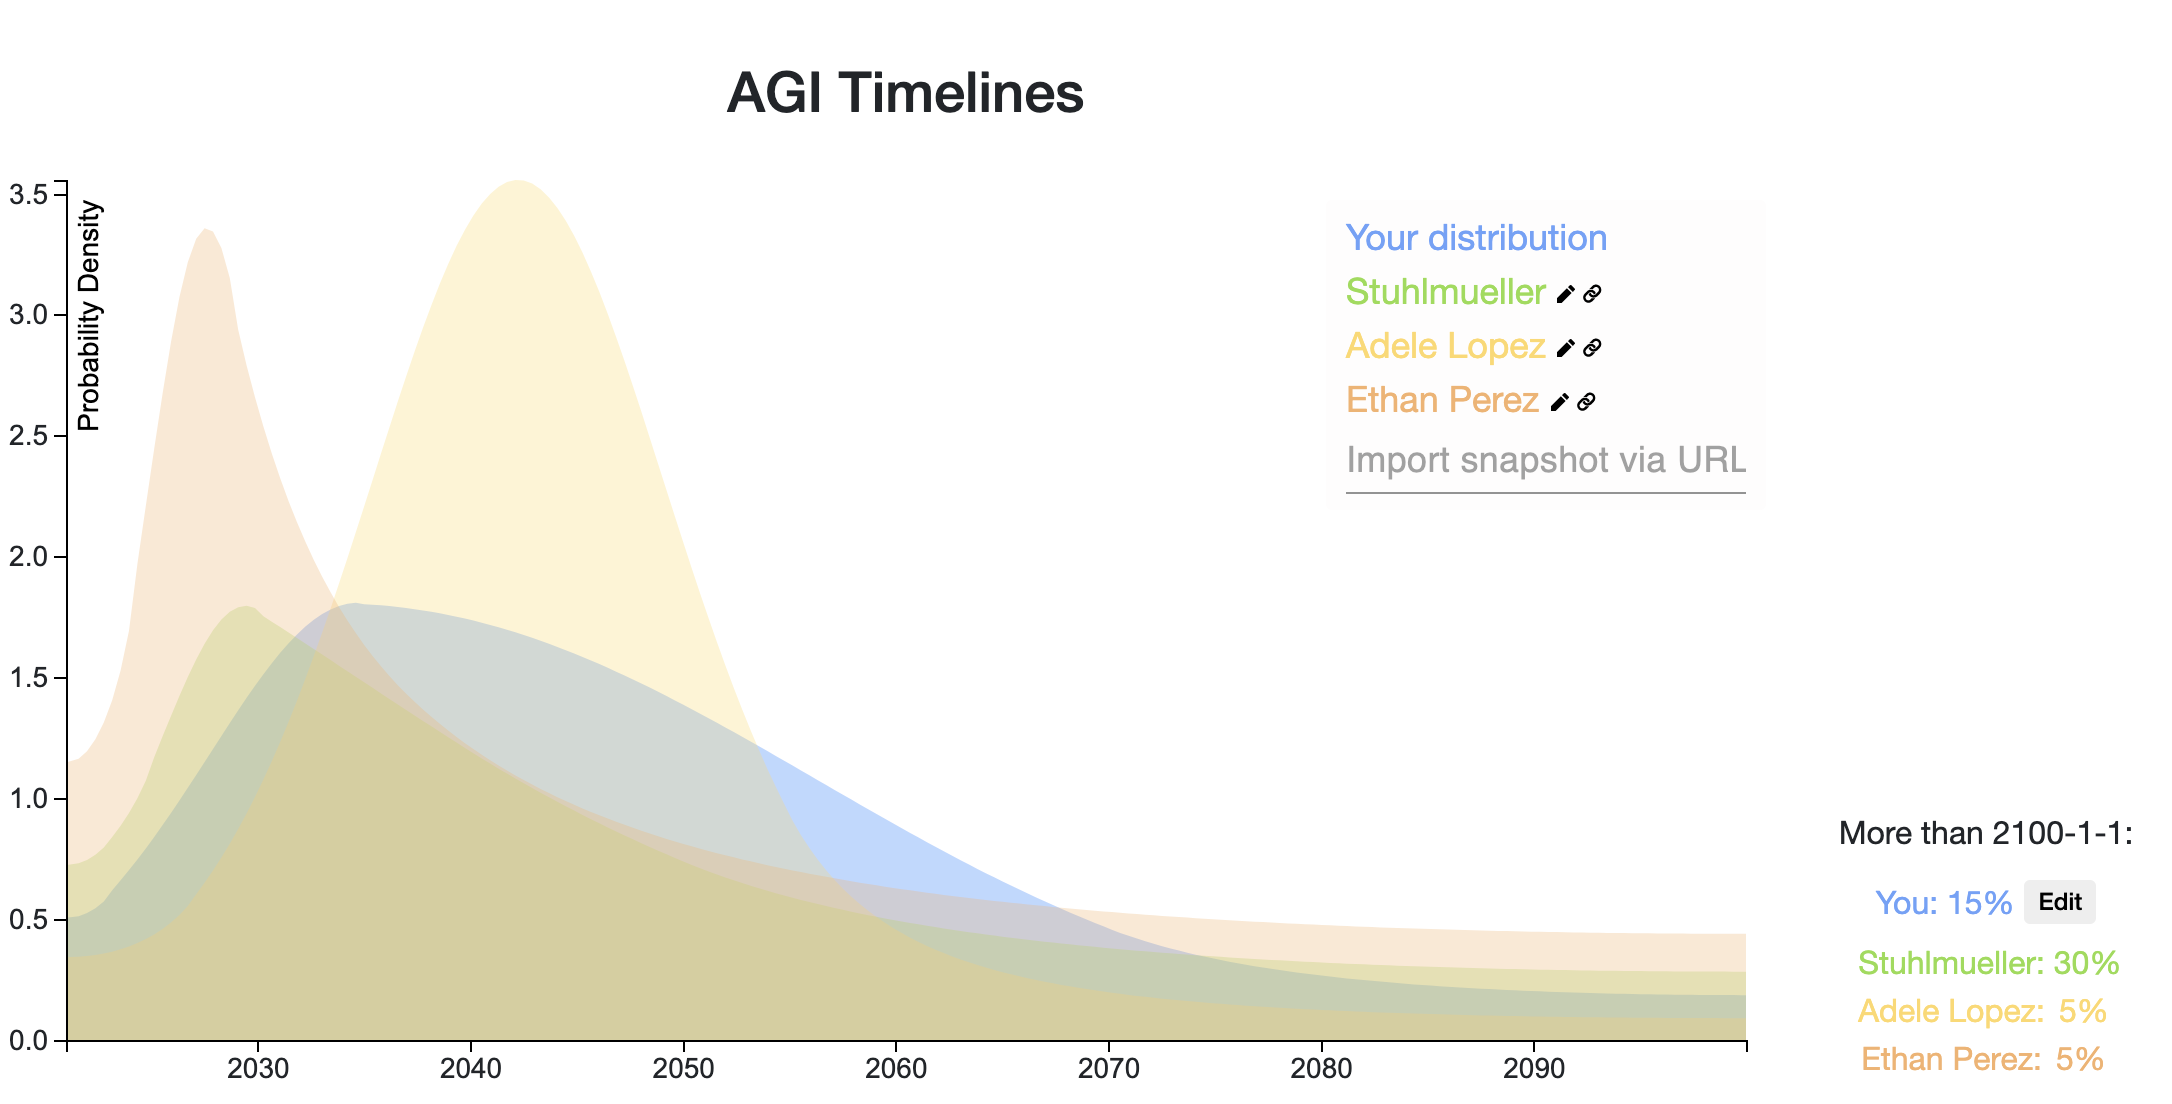
- Include someone else's distribution who you disagree with, and speculate as to the disagreement
How to make a distribution using Elicit
- Go to this page.
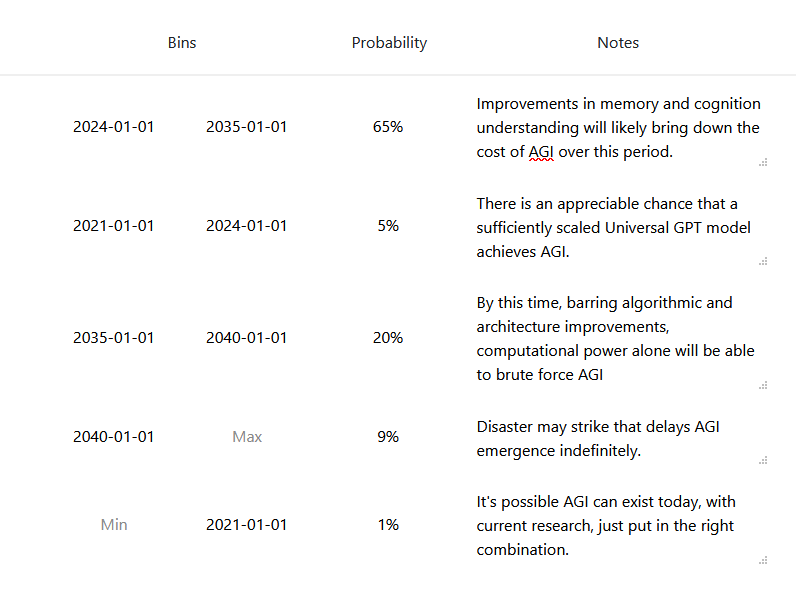
- Enter your beliefs in the bins.
- Specify an interval using the Min and Max bin, and put the probability you assign to that interval in the probability bin.
- For example, if you think there's a 50% probability of AGI before 2050, you can leave Min blank (it will default to the Min of the question range), enter 2050 in the Max bin, and enter 50% in the probability bin.
- The minimum of the range is January 1, 2021, and the maximum is January 1, 2100. You can assign probability above January 1, 2100 (which also includes 'never') or below January 1, 2021 using the Edit buttons next to the graph.
- Click 'Save snapshot,' to save your distribution to a static URL.
- A timestamp will appear below the 'Save snapshot' button. This links to the URL of your snapshot.
- Make sure to copy it before refreshing the page, otherwise it will disappear.
- Copy the snapshot timestamp link and paste it into your LessWrong comment.
- You can also add a screenshot of your distribution using the instructions below.
How to overlay distributions on the same graph
- Copy your snapshot URL.
- Paste it into the Import snapshot via URL box on the snapshot you want to compare your prediction to (e.g. the snapshot of Alex's distributions).
- Rename your distribution to keep track.
- Take a new snapshot if you want to save or share the overlaid distributions.
How to add an image to your comment
- Take a screenshot of your distribution
- Then do one of two things:
- If you have beta-features turned on in your account settings, drag-and-drop the image into your comment
- If not, upload it to an image hosting service, then write the following markdown syntax for the image to appear, with the url appearing where it says ‘link’: 
- If it worked, you will see the image in the comment before hitting submit.
If you have any bugs or technical issues, reply to Ben (here) in the comment section.
Top Forecast Comparisons
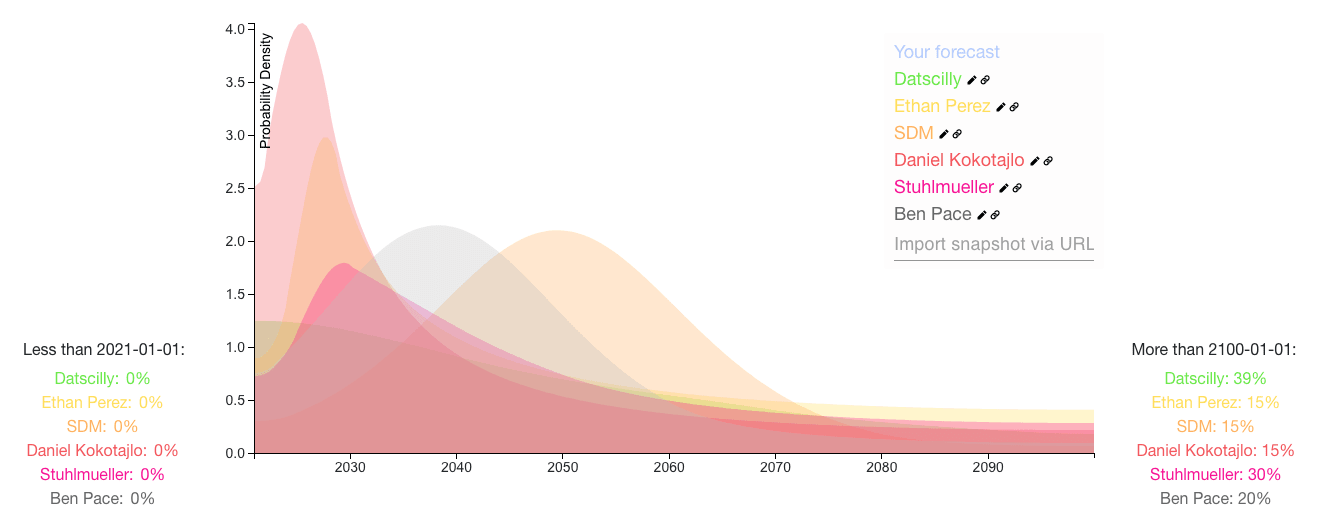
Here is a snapshot of the top voted forecasts from this thread, last updated 9/01/20. You can click the dropdown box near the bottom right of the graph to see the bins for each prediction.
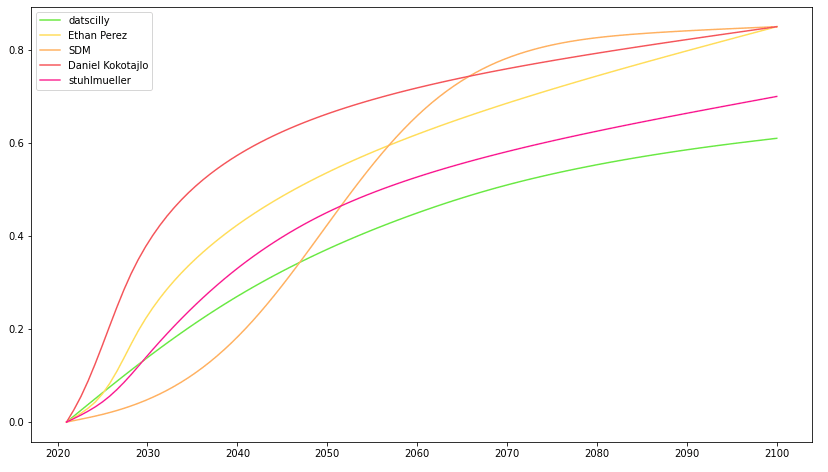
Here is a comparison of the forecasts as a CDF:
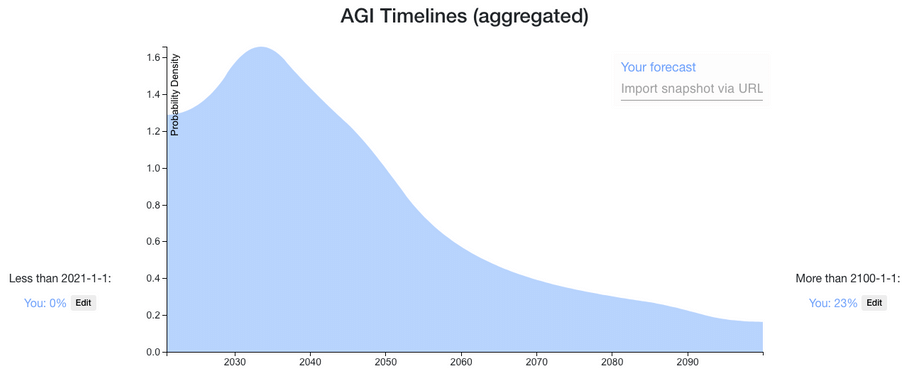
Here is a mixture of the distributions on this thread, weighted by normalized votes (last updated 9/01/20). The median is June 20, 2047. You can click the Interpret tab on the snapshot to see more percentiles.


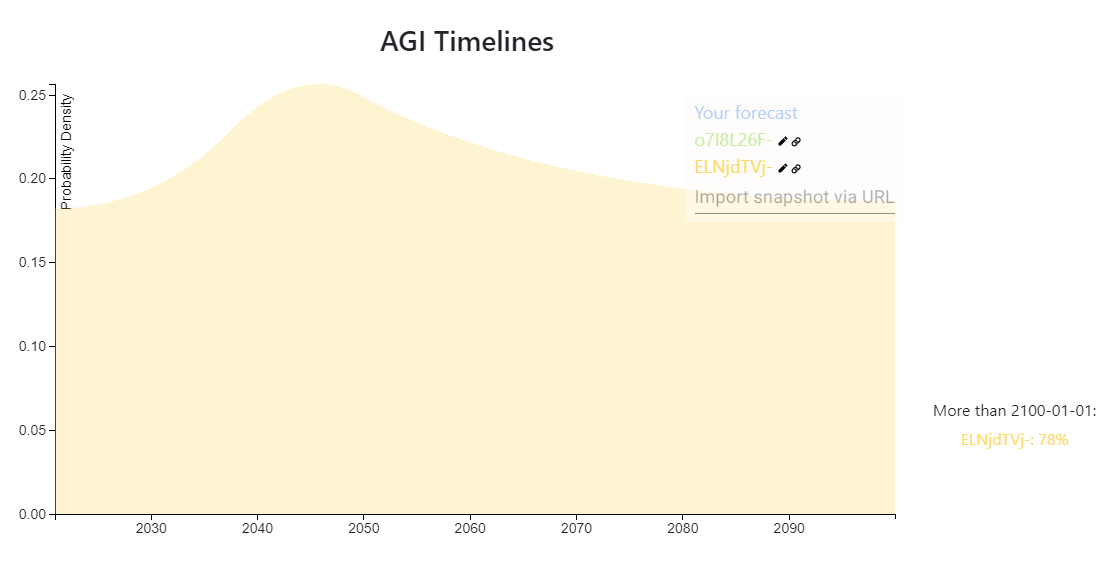

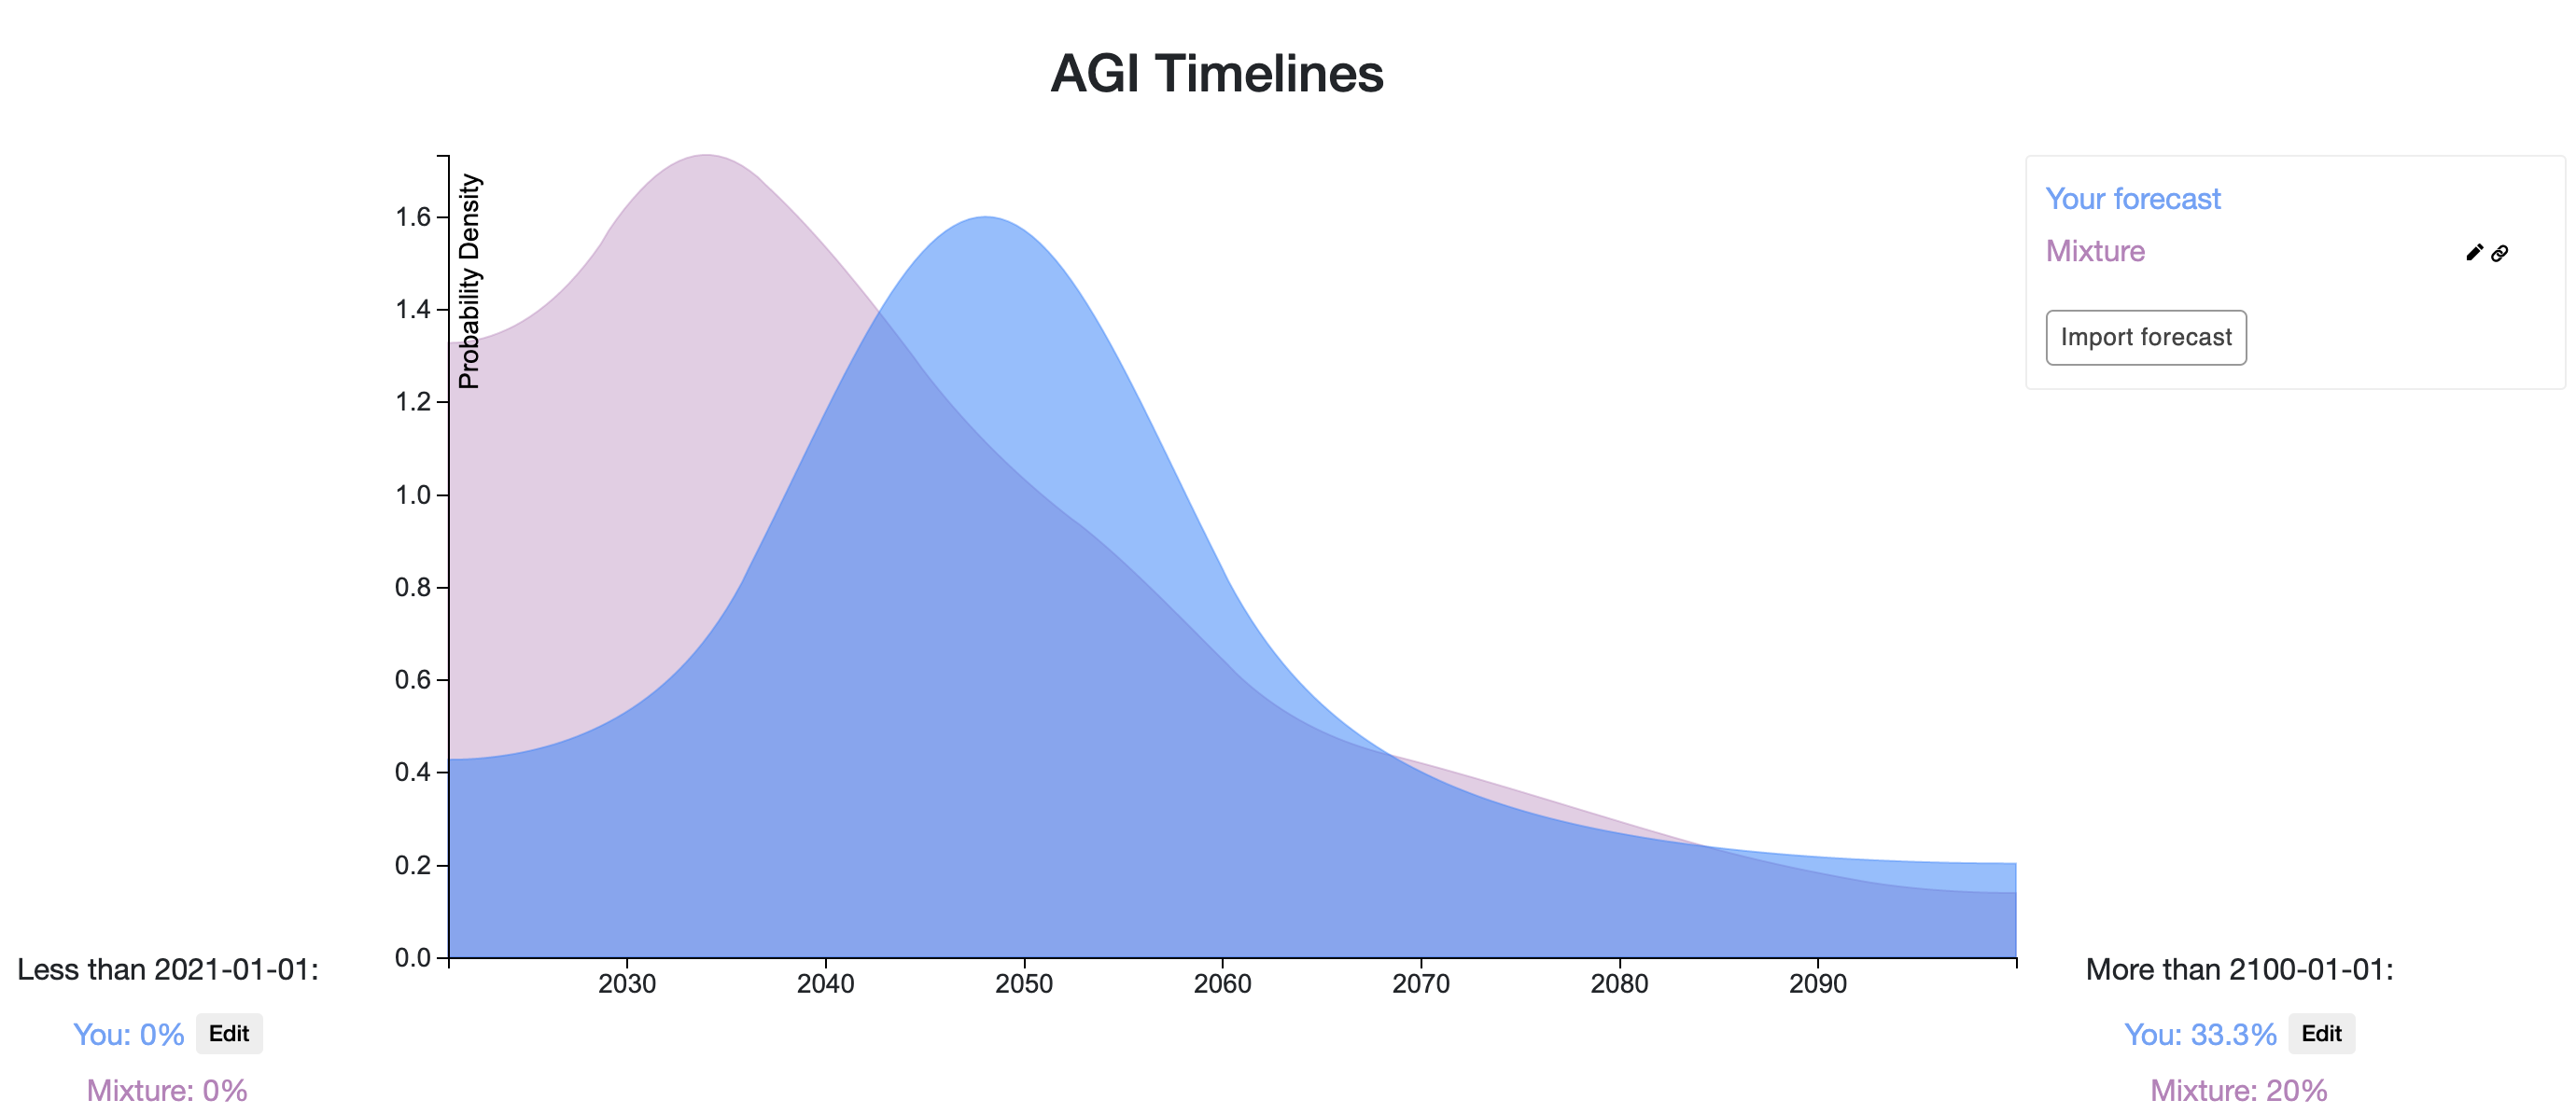
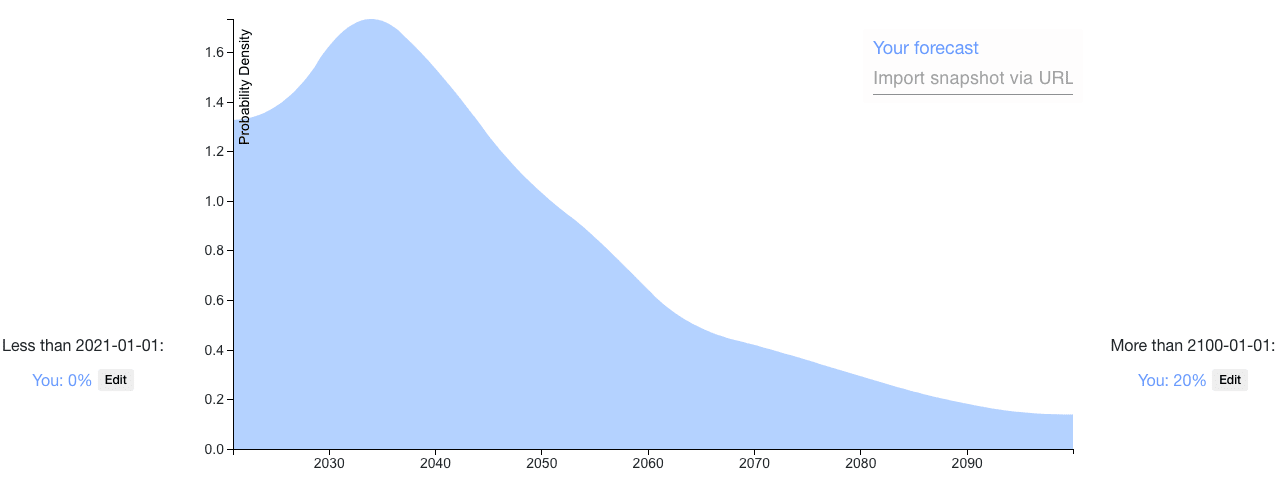
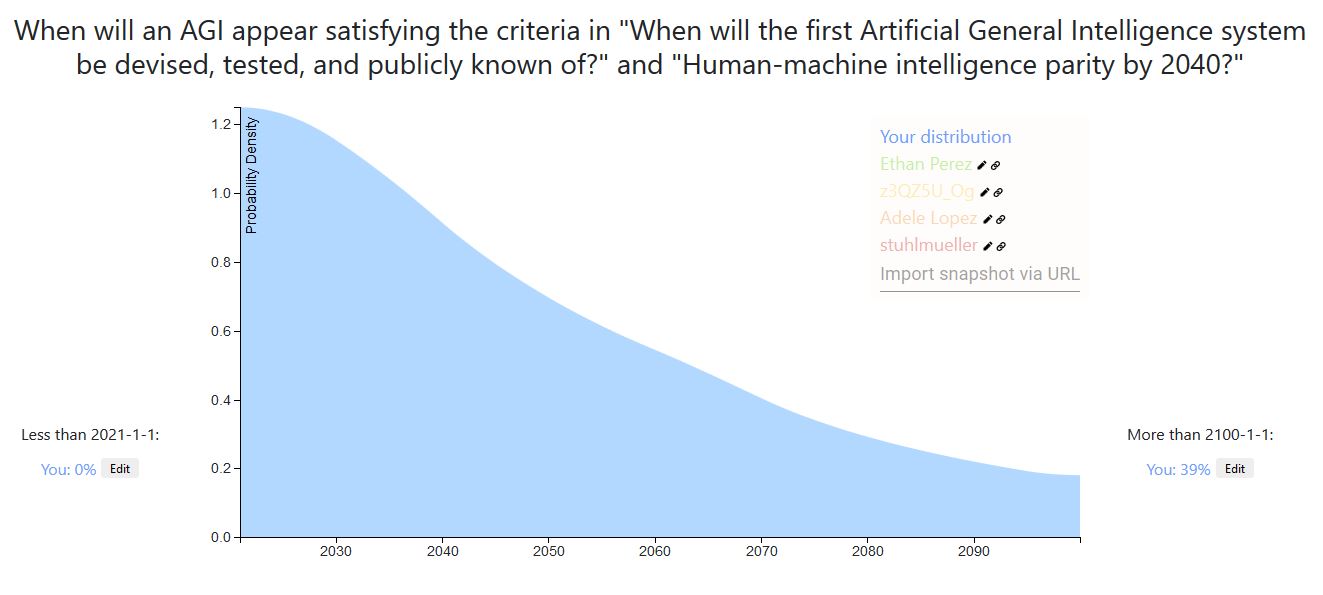
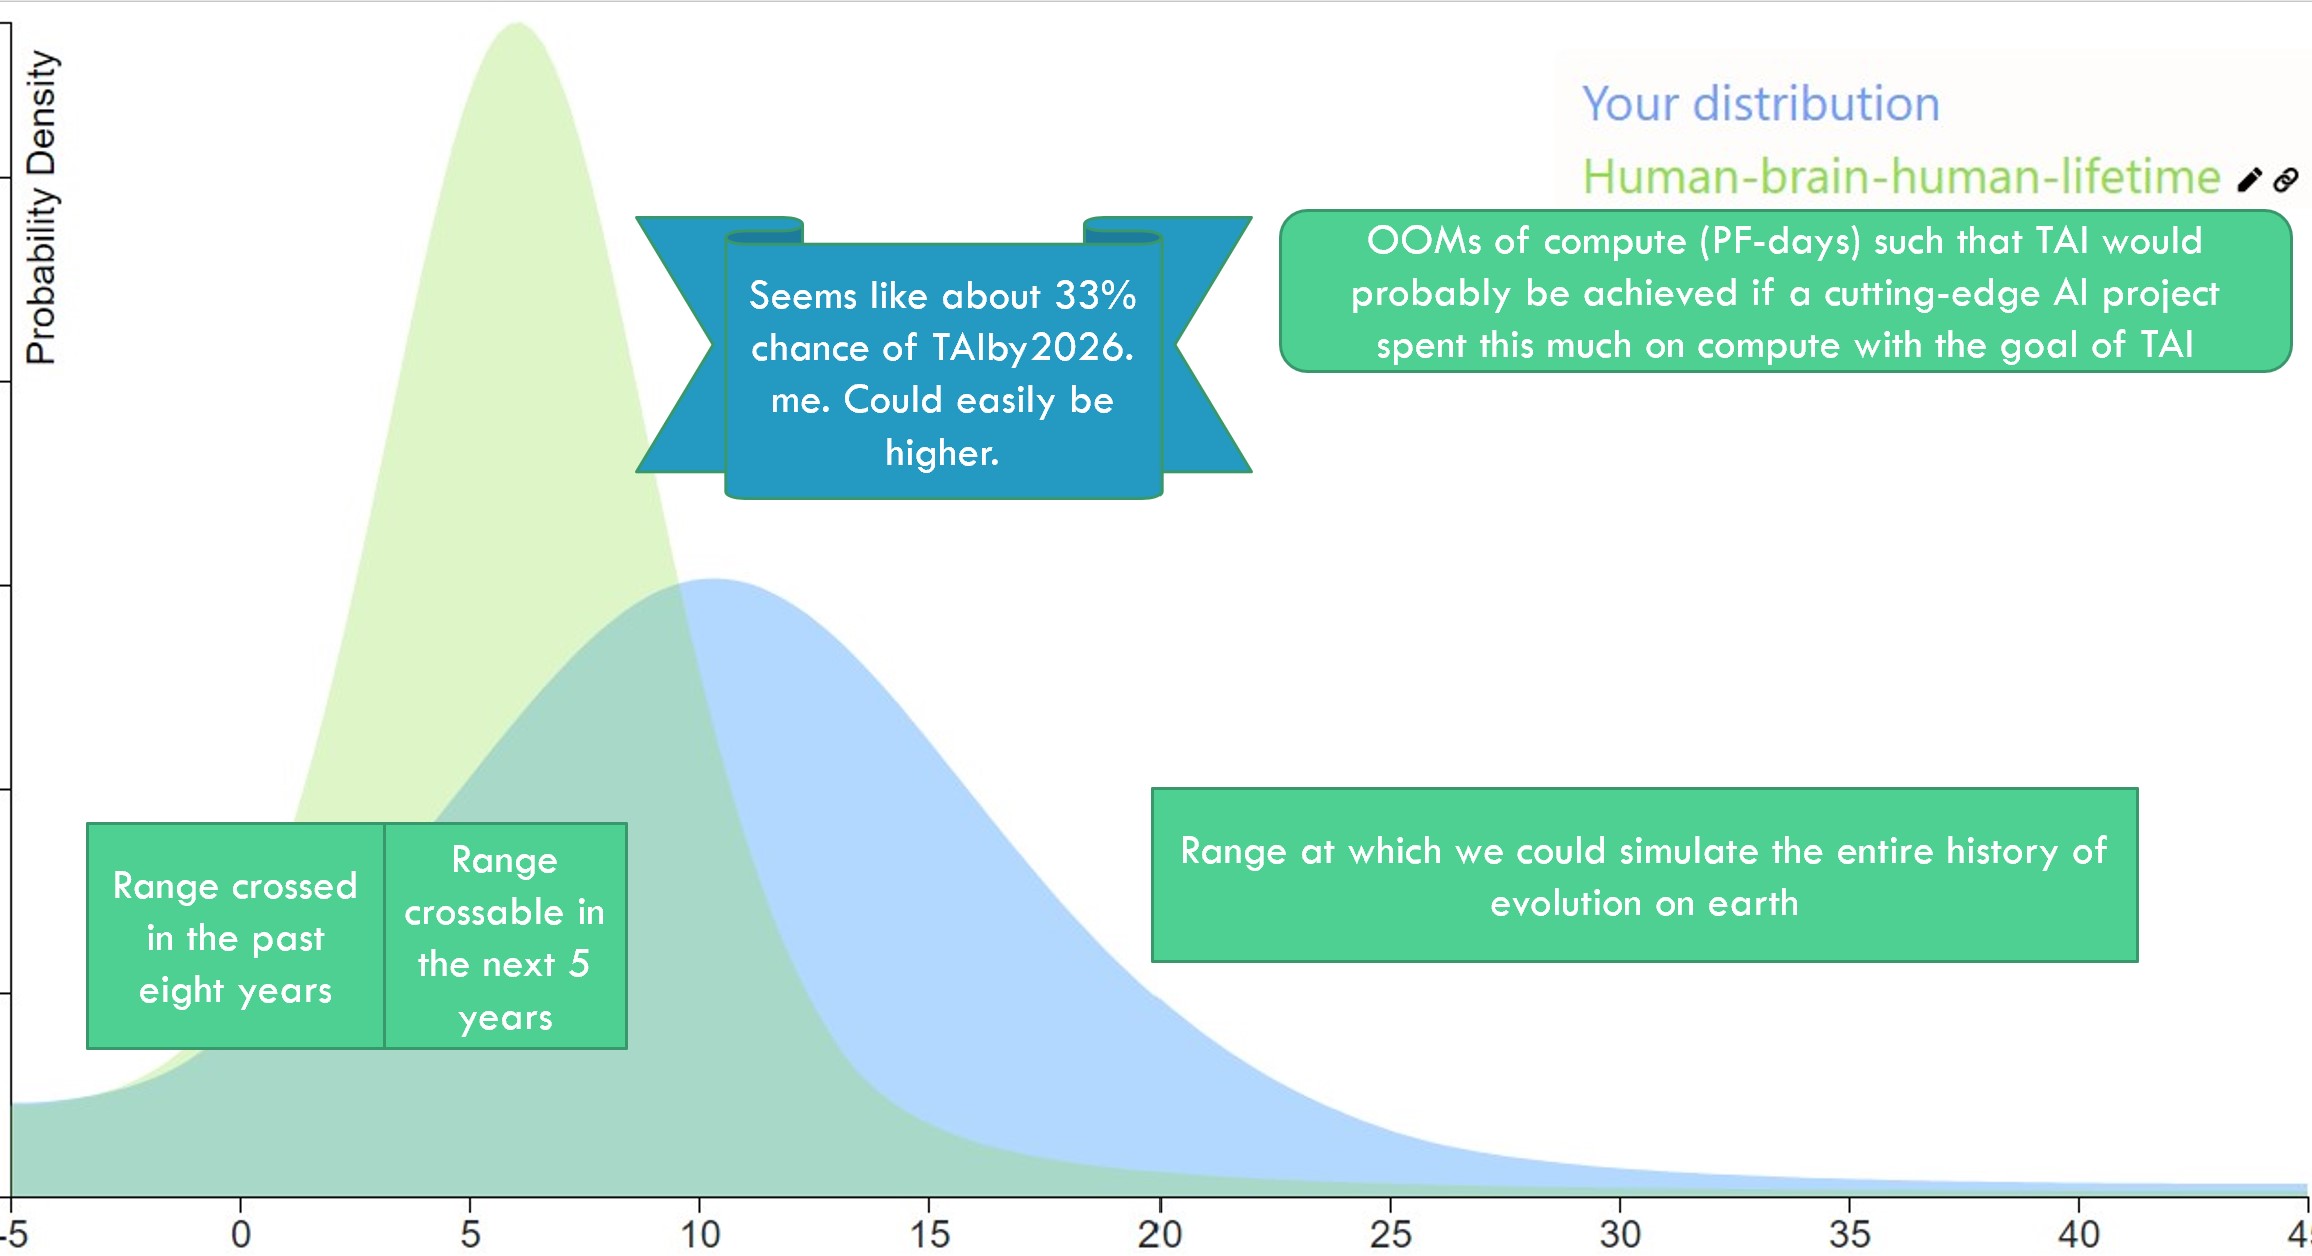
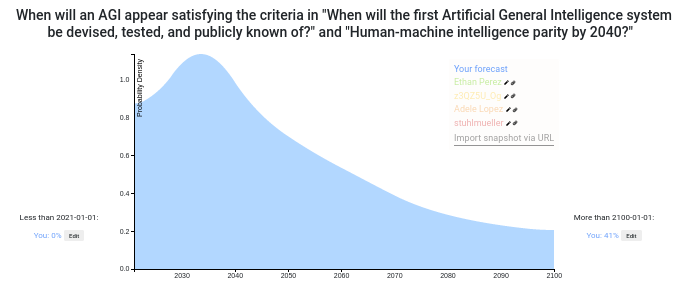
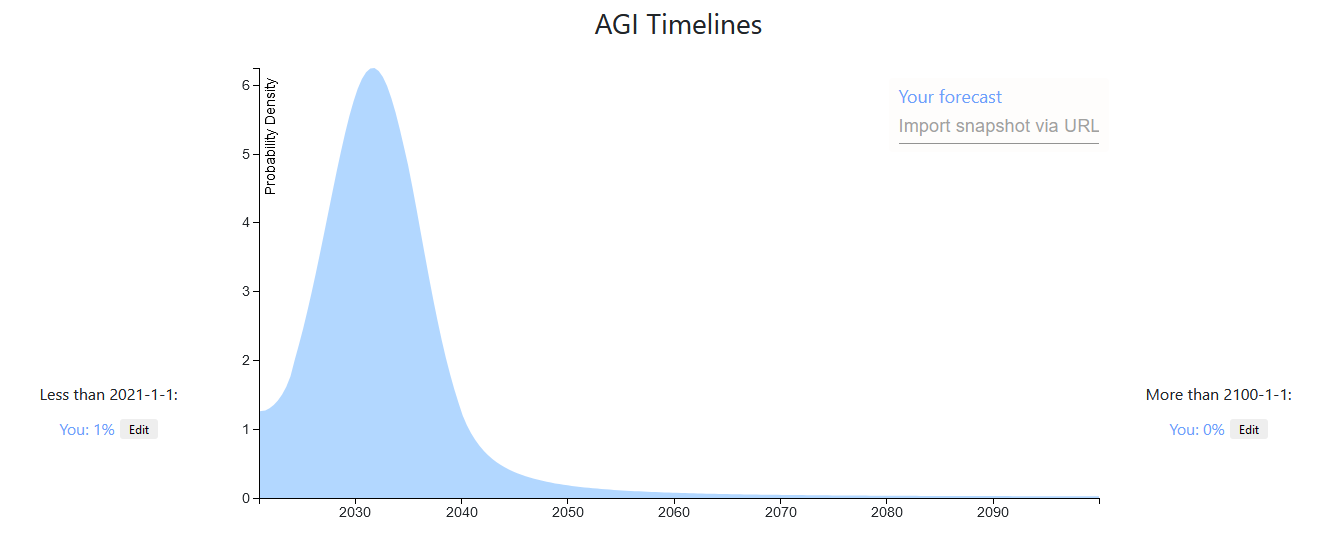
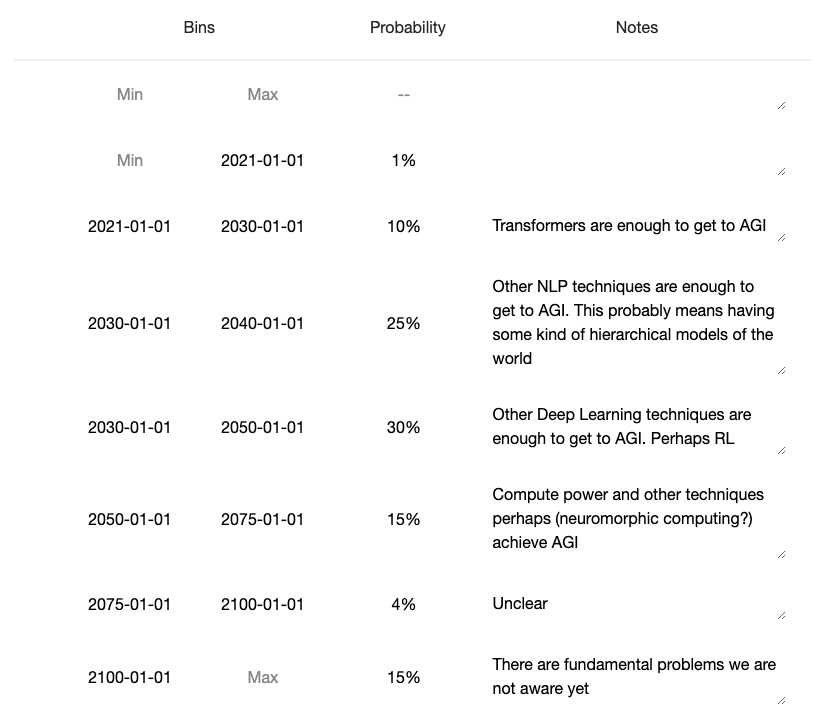
If AGI is taken to mean, the first year that there is radical economic, technological, or scientific progress, then these are my AGI timelines.
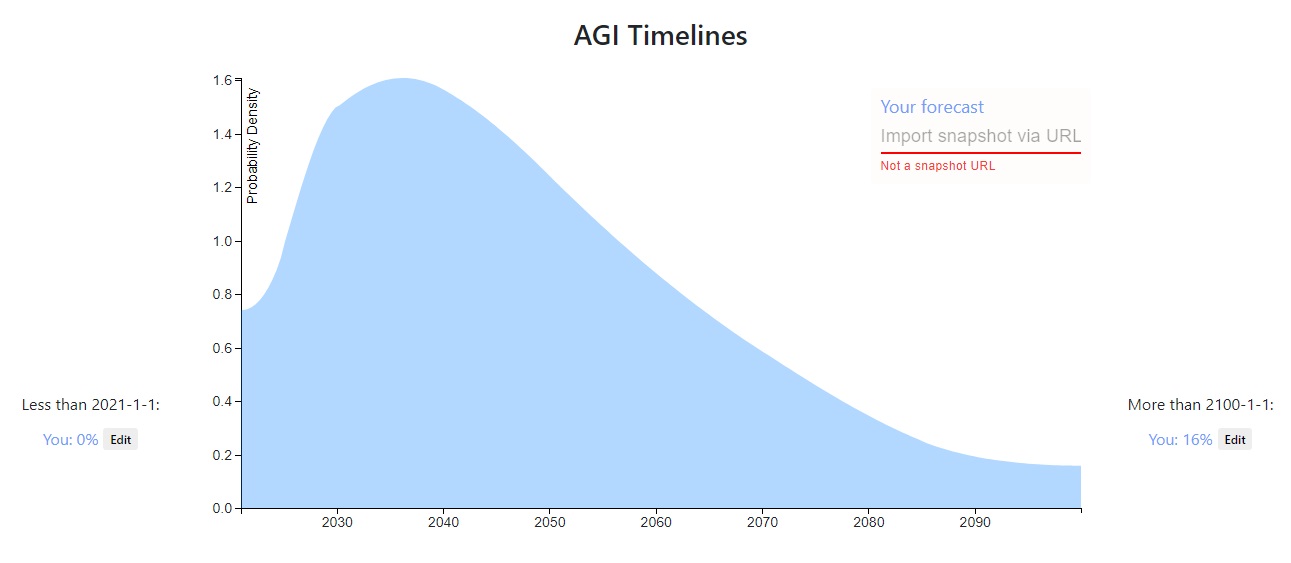
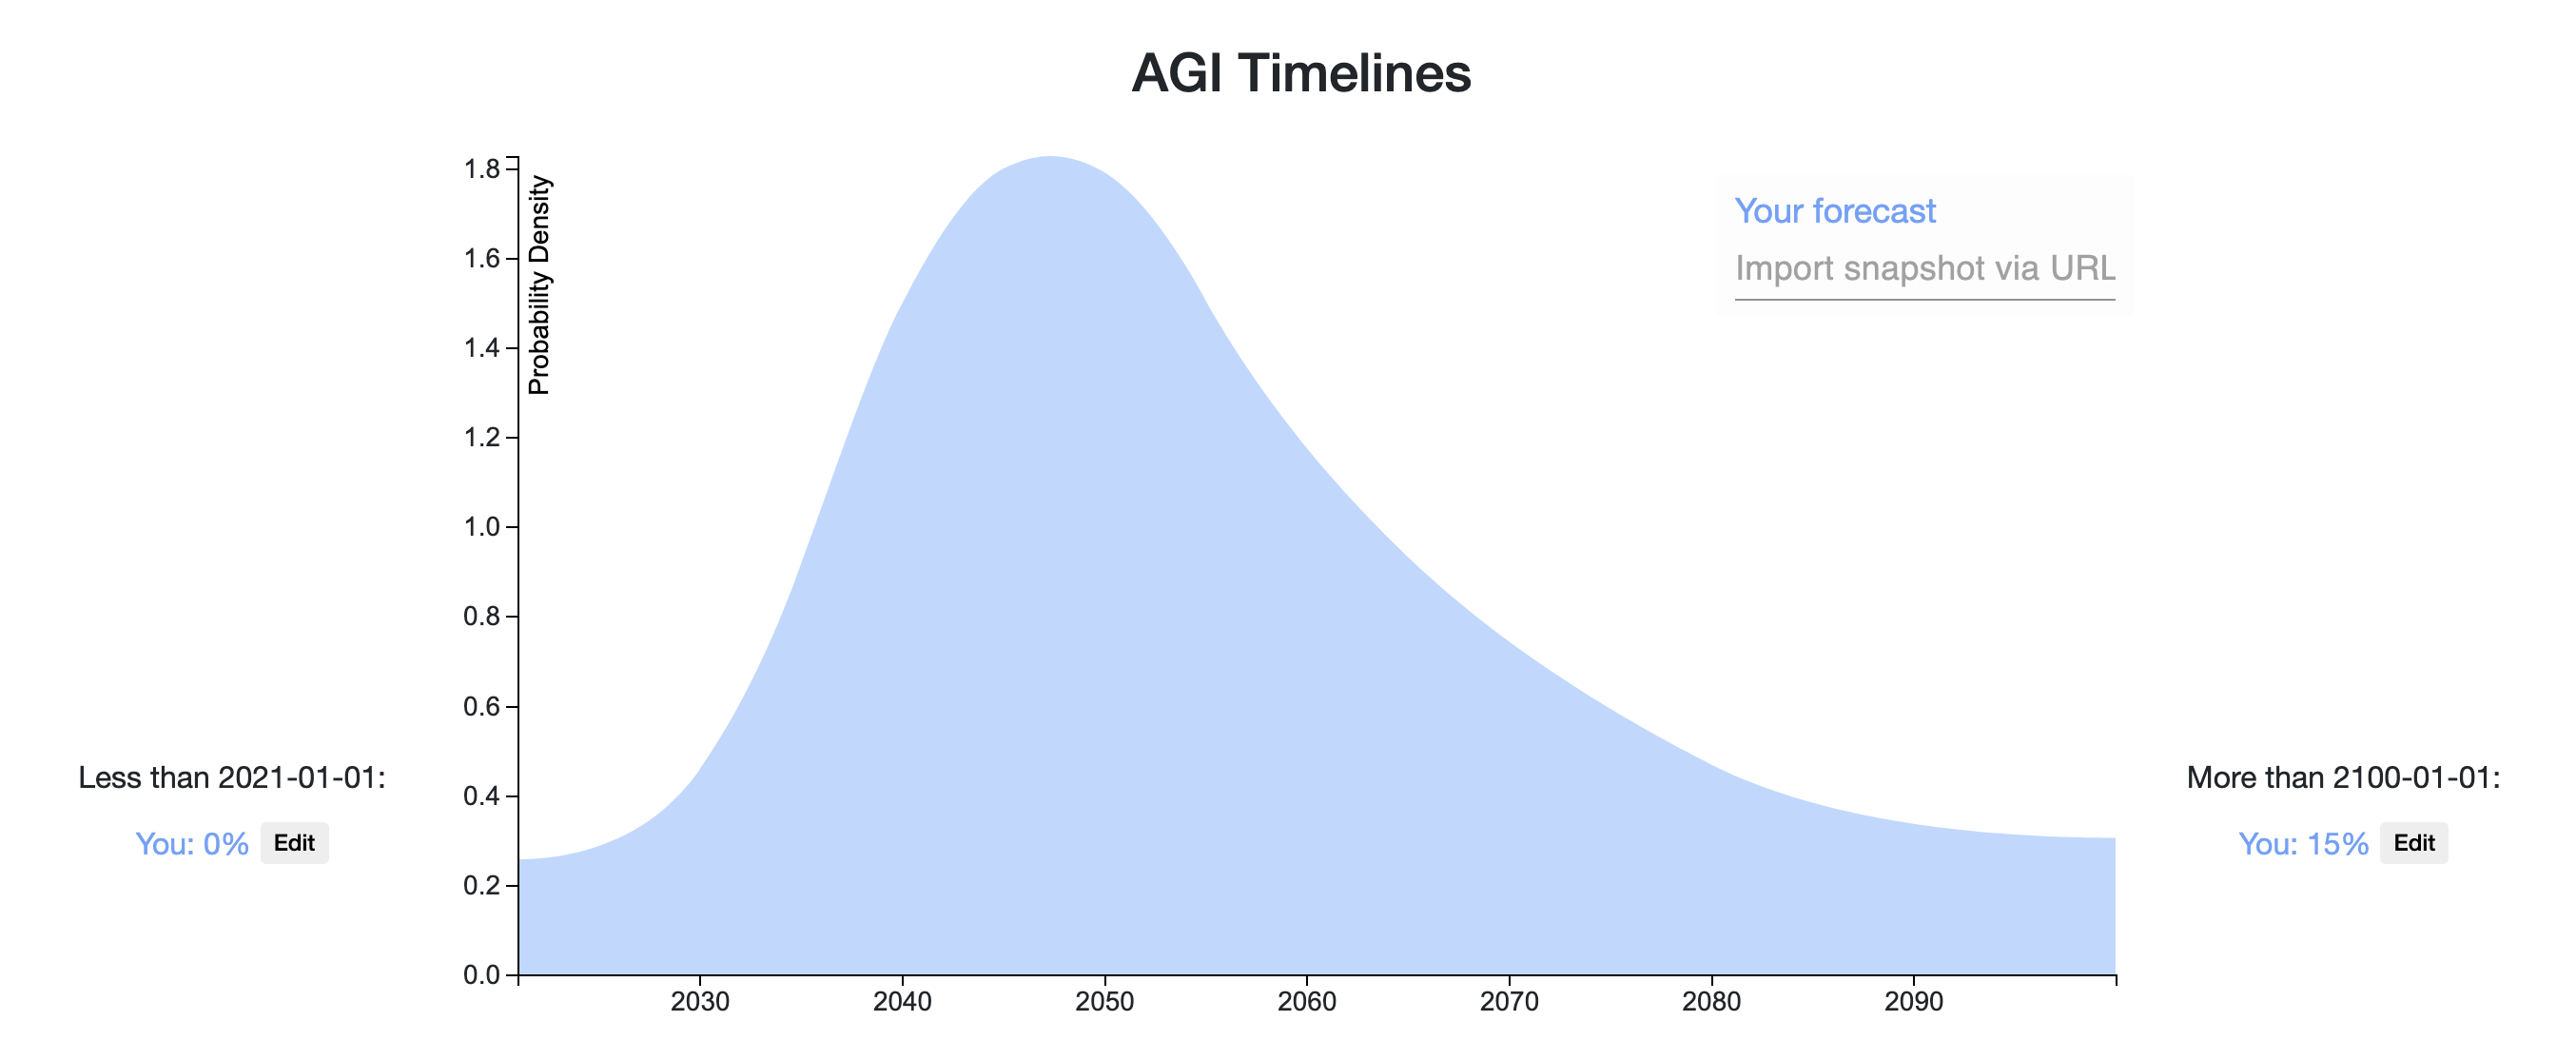
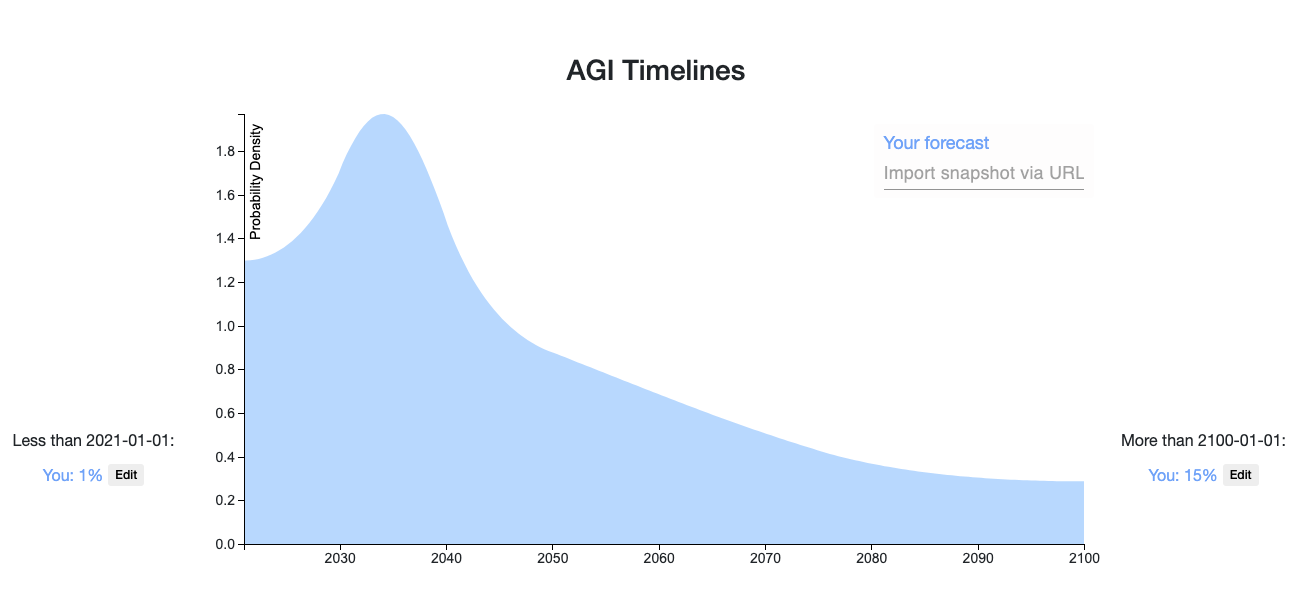
My percentiles
I have a bit lower probability for near-term AGI than many people here are. I model my biggest disagreement as about how much work is required to move from high-cost impressive demos to real economic performance. I also have an intuition that it is really hard to automate everything and progress will be bottlenecked by the tasks that are essential but very hard to automate.
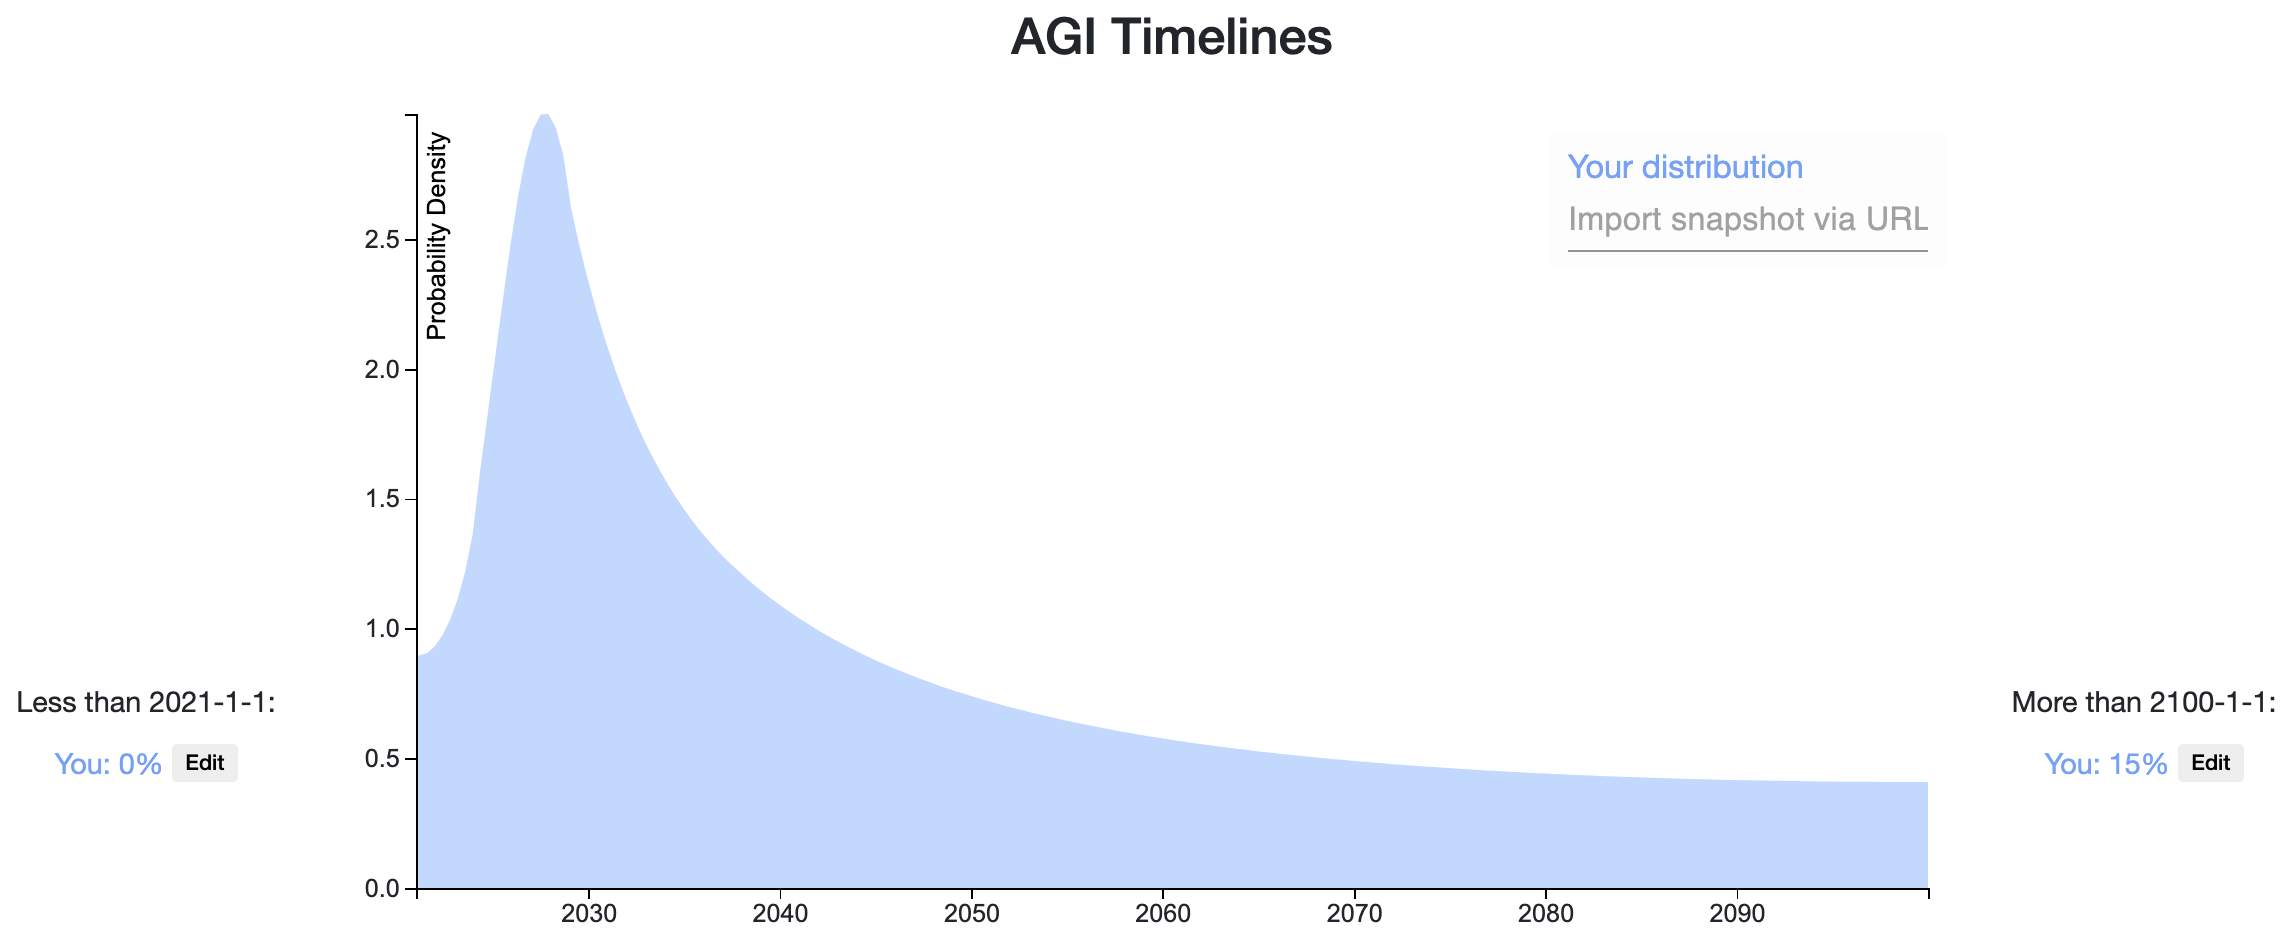
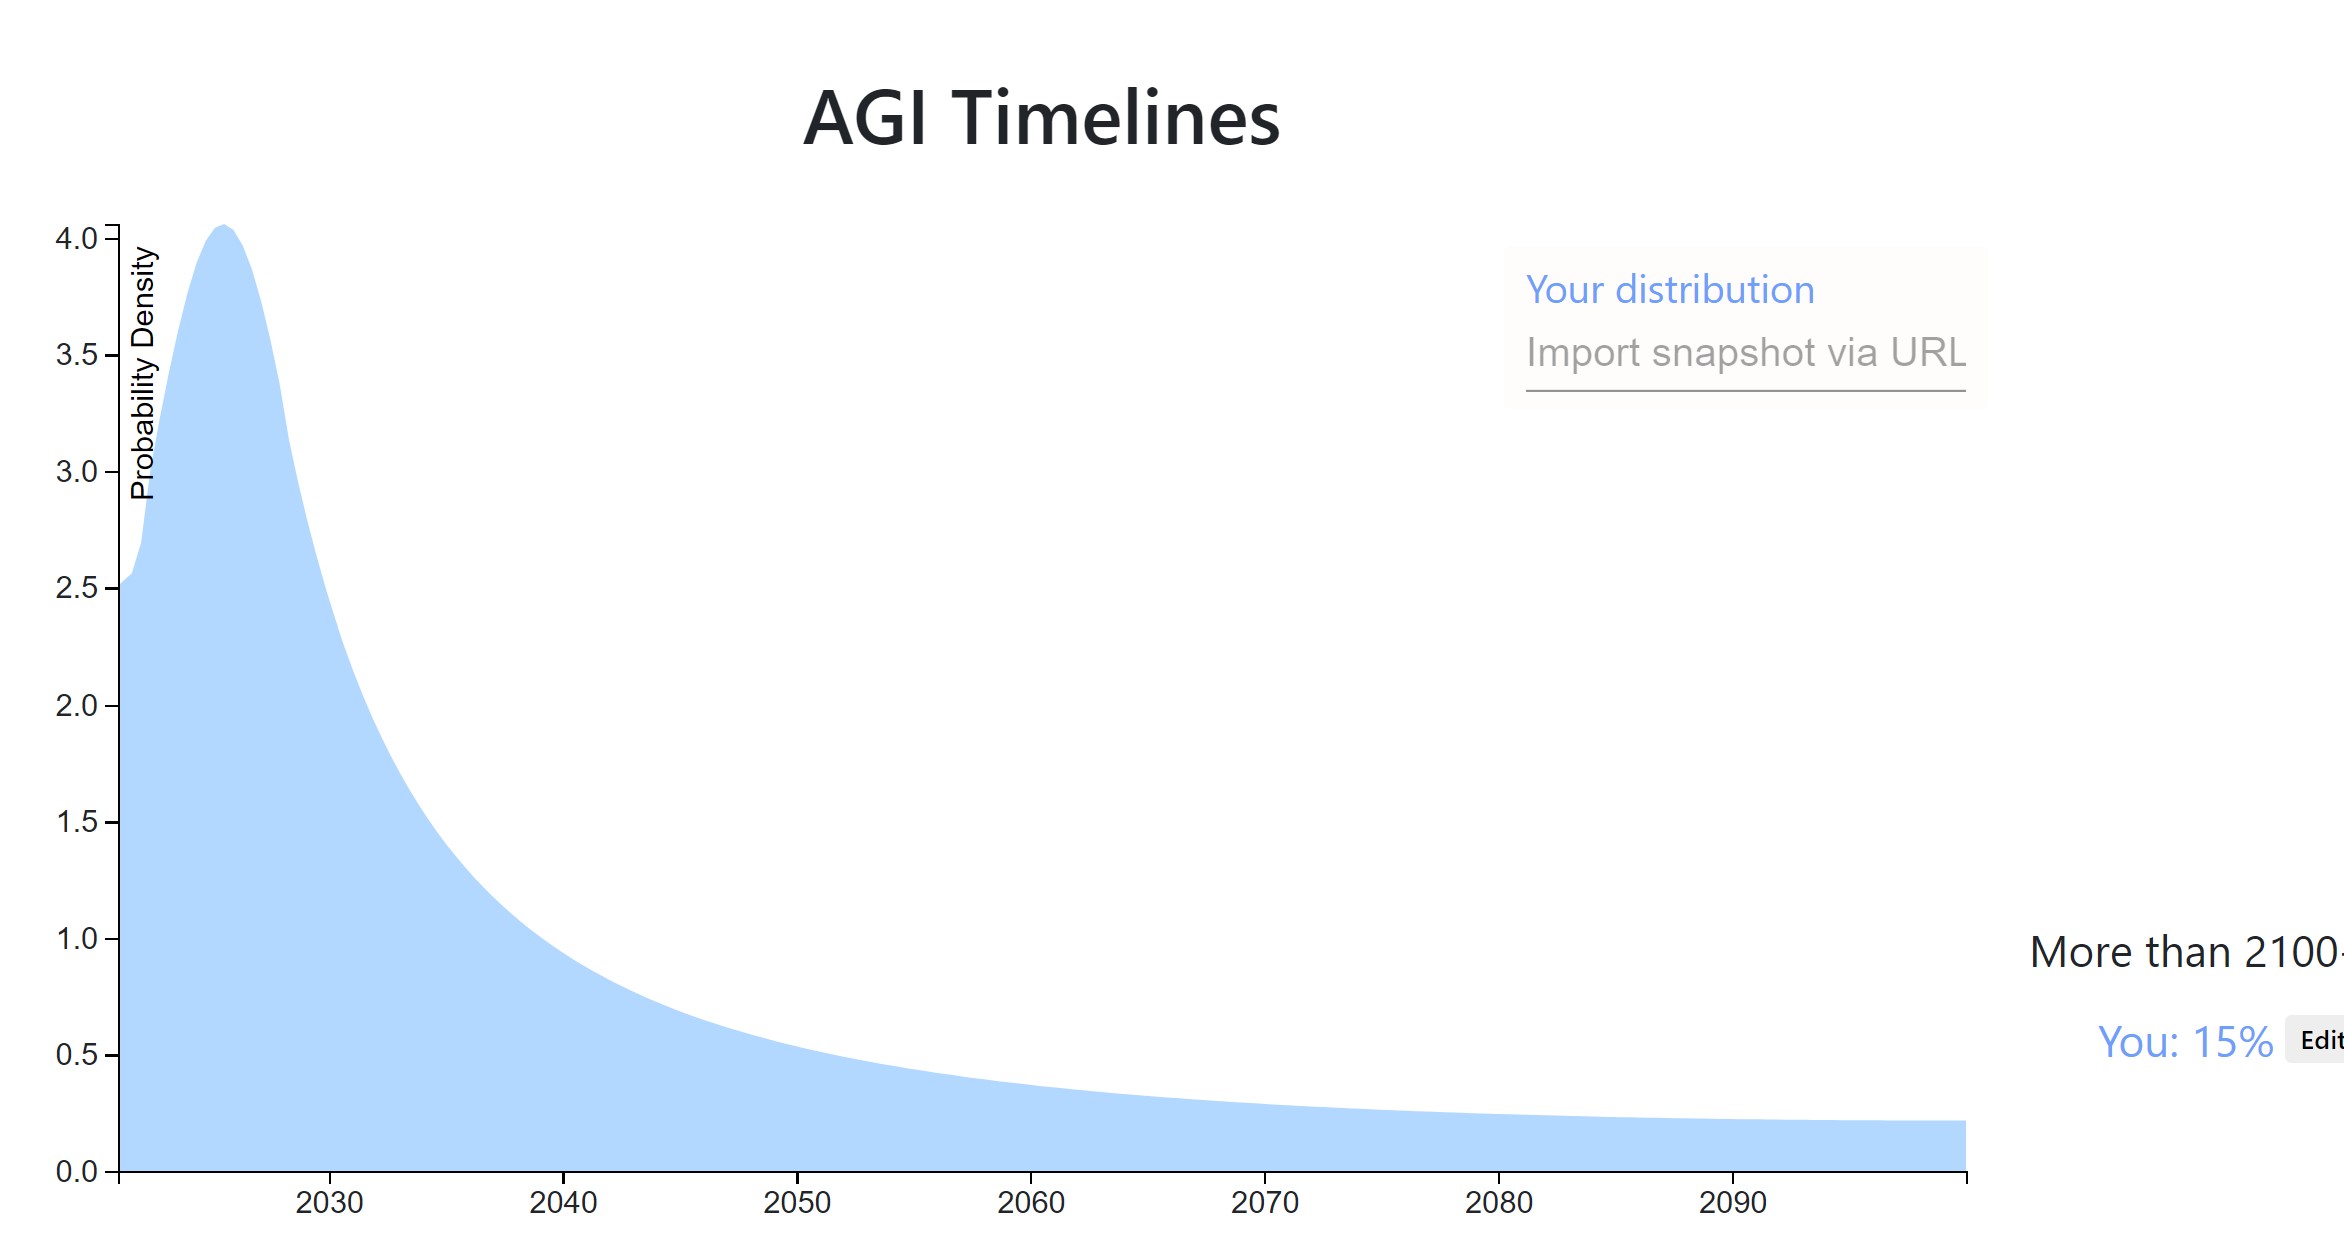
Some updates:
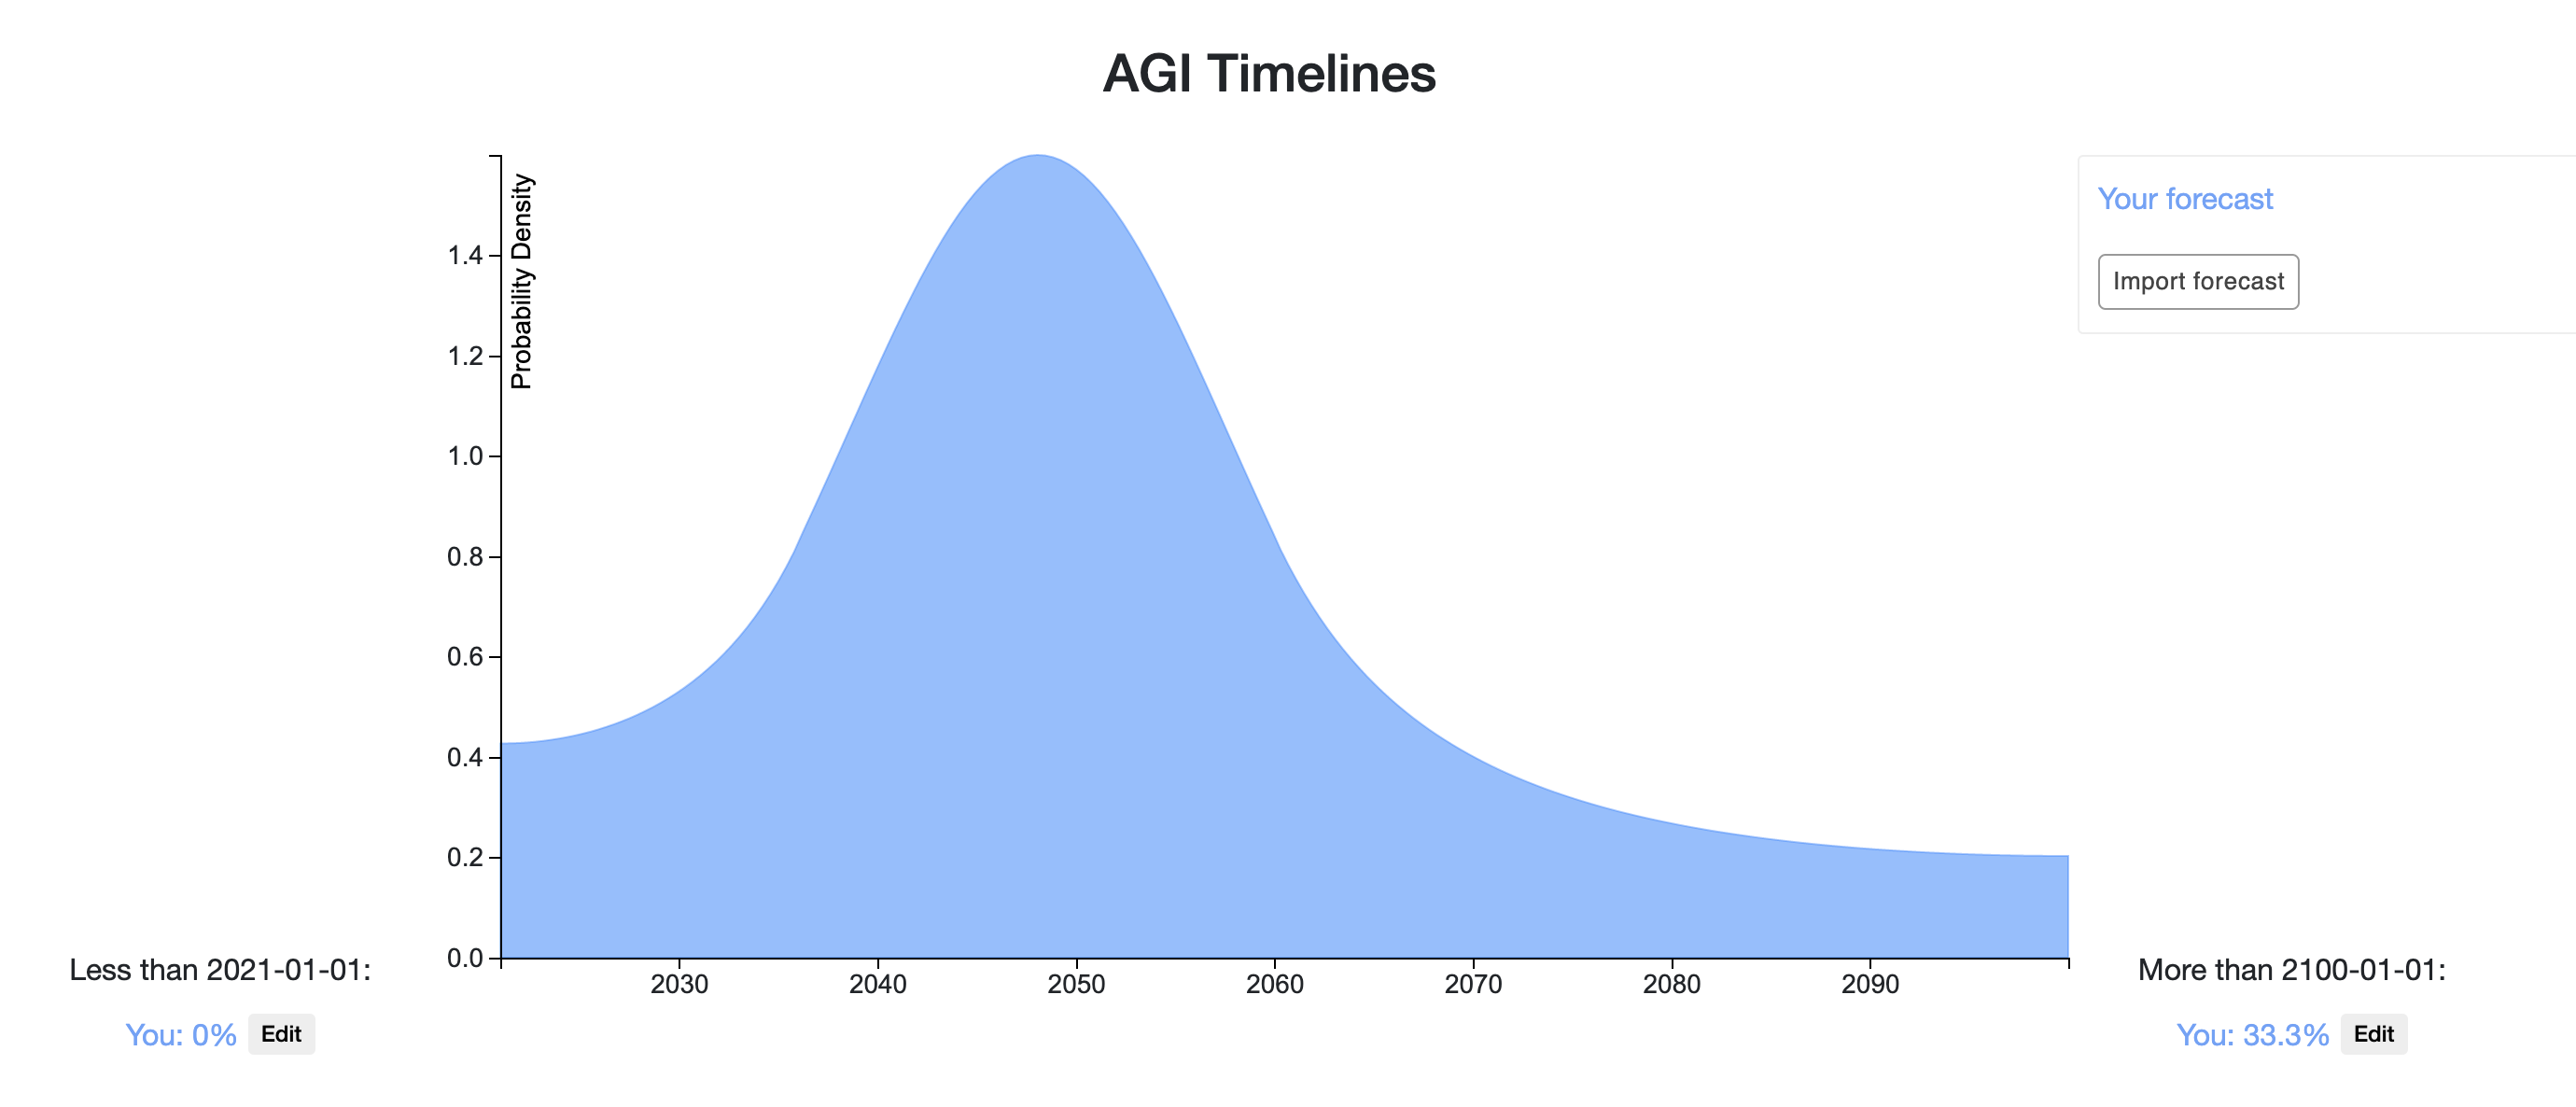
- I now have an operationalization of AGI I feel happy about, and I think it's roughly just as difficult as creating transformative AI (though perhaps still slightly easier).
- I have less probability now on very long timelines (>80 years). Previously I had 39% credence on AGI arriving after 2100, but I now only have about 25% credence.
- I also have a bit more credence on short timelines, mostly because I think the potential for massive investment is real, and it doesn't seem implausible that we could spend >1% of our GDP on AI development at s
... (read more)